Water Conservation
Operating System

Water Conservation
Operating System

Water Conservation
Operating System

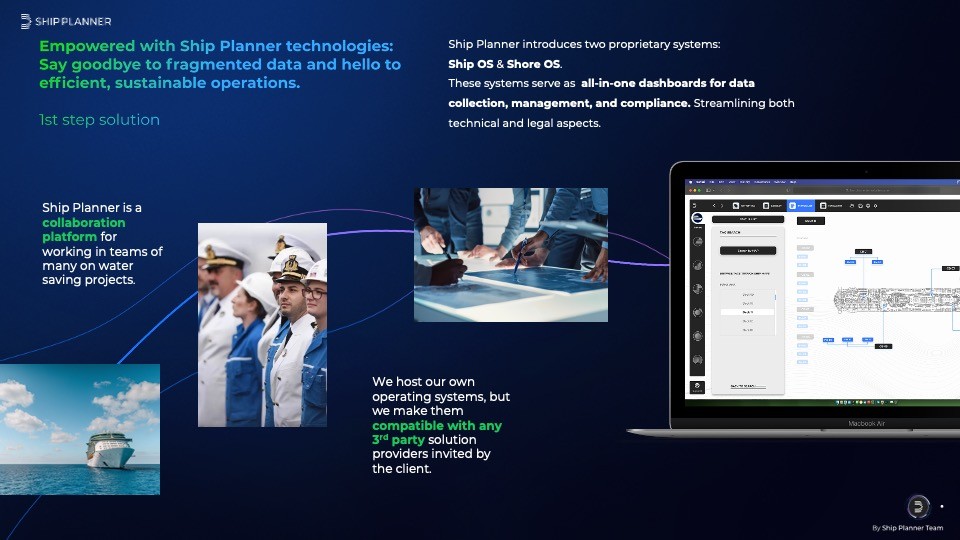
Ship OS is all in one dashboard, designed by a Norwegian tech firm Ship Planner. 

The systems are used to harvest and refine ship data for reducing water, fuels and other liquid consumption on ships. 

Ship OS is all in one dashboard, designed by a Norwegian tech firm Ship Planner. 

The systems are used to harvest and refine ship data for reducing water, fuels and other liquid consumption on ships. 

01

PROJECT

INFORMATION

CLIENT

Ship Planner AS

PROJECT DURATION

2019 - 2024

WORK SCOPE

User Experience / User Interface

Product Design / Strategy

LOCATION

Oslo, NORWAY

02

SHIP OS

TECH

Design of the Ship Os front-end and water applications speaks language of disruptive technology. 

The goal was to streamline user journey with clarity and easiness.


From cost & emission reports via data ownership definition to unique insights trough algorithms.

03

CHALLENGE

Old fashioned manual reports, taken daily under pressured conditions.


Non-digital data exchange solutions.


No water data behavior visualized.

04

SOLUTION

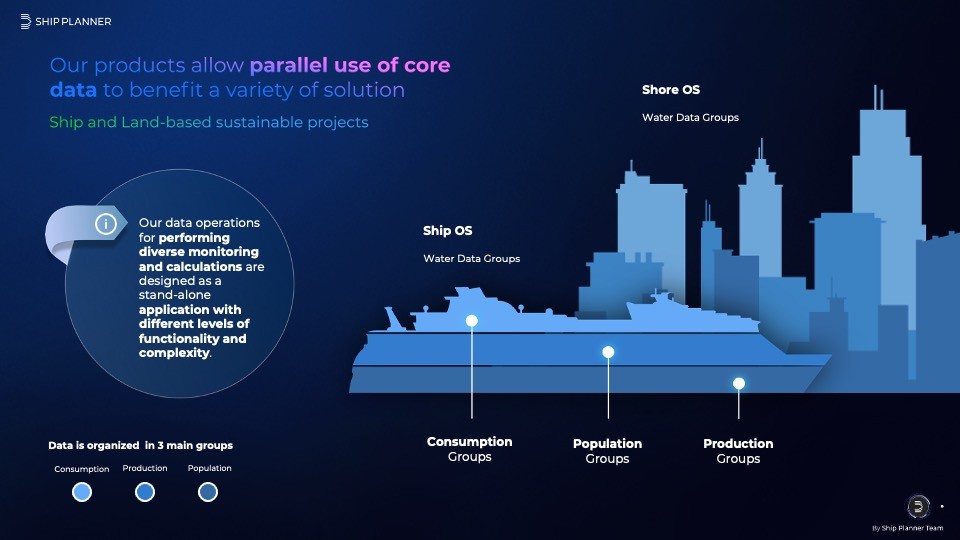
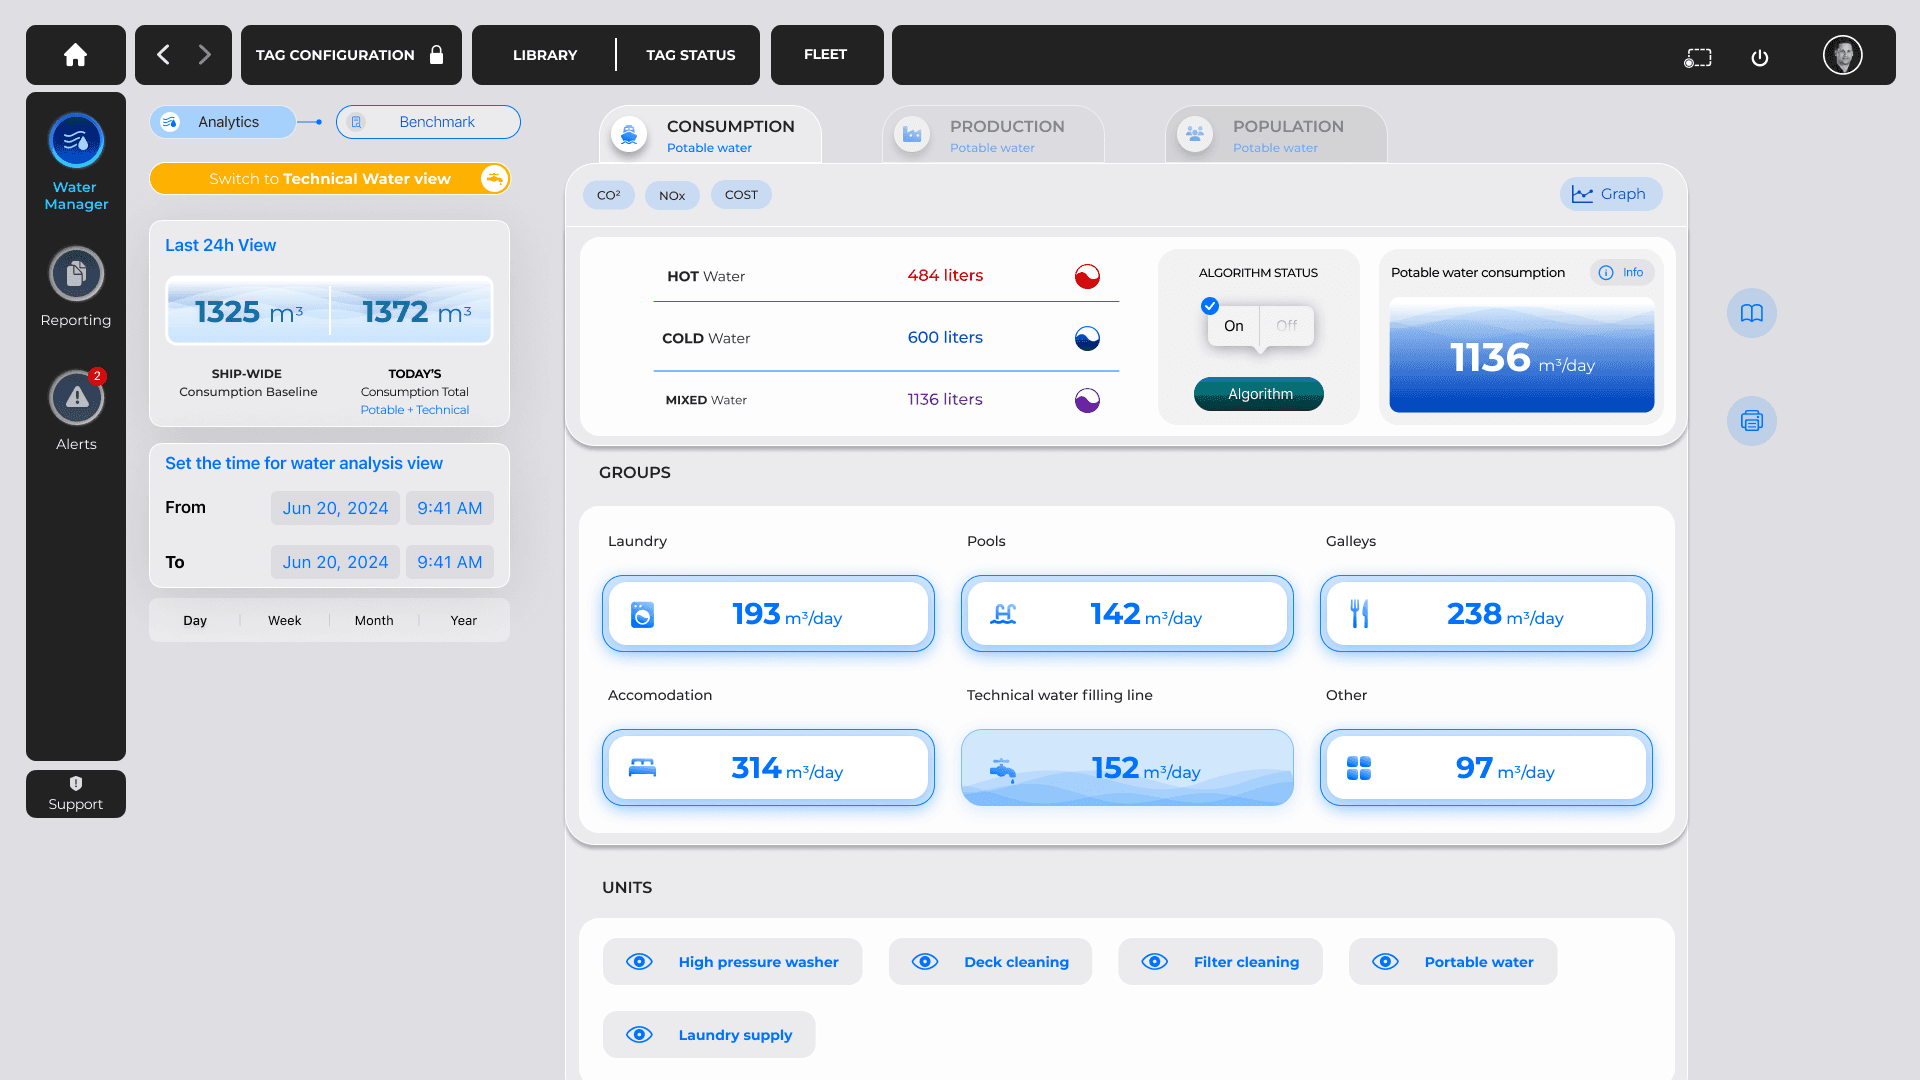
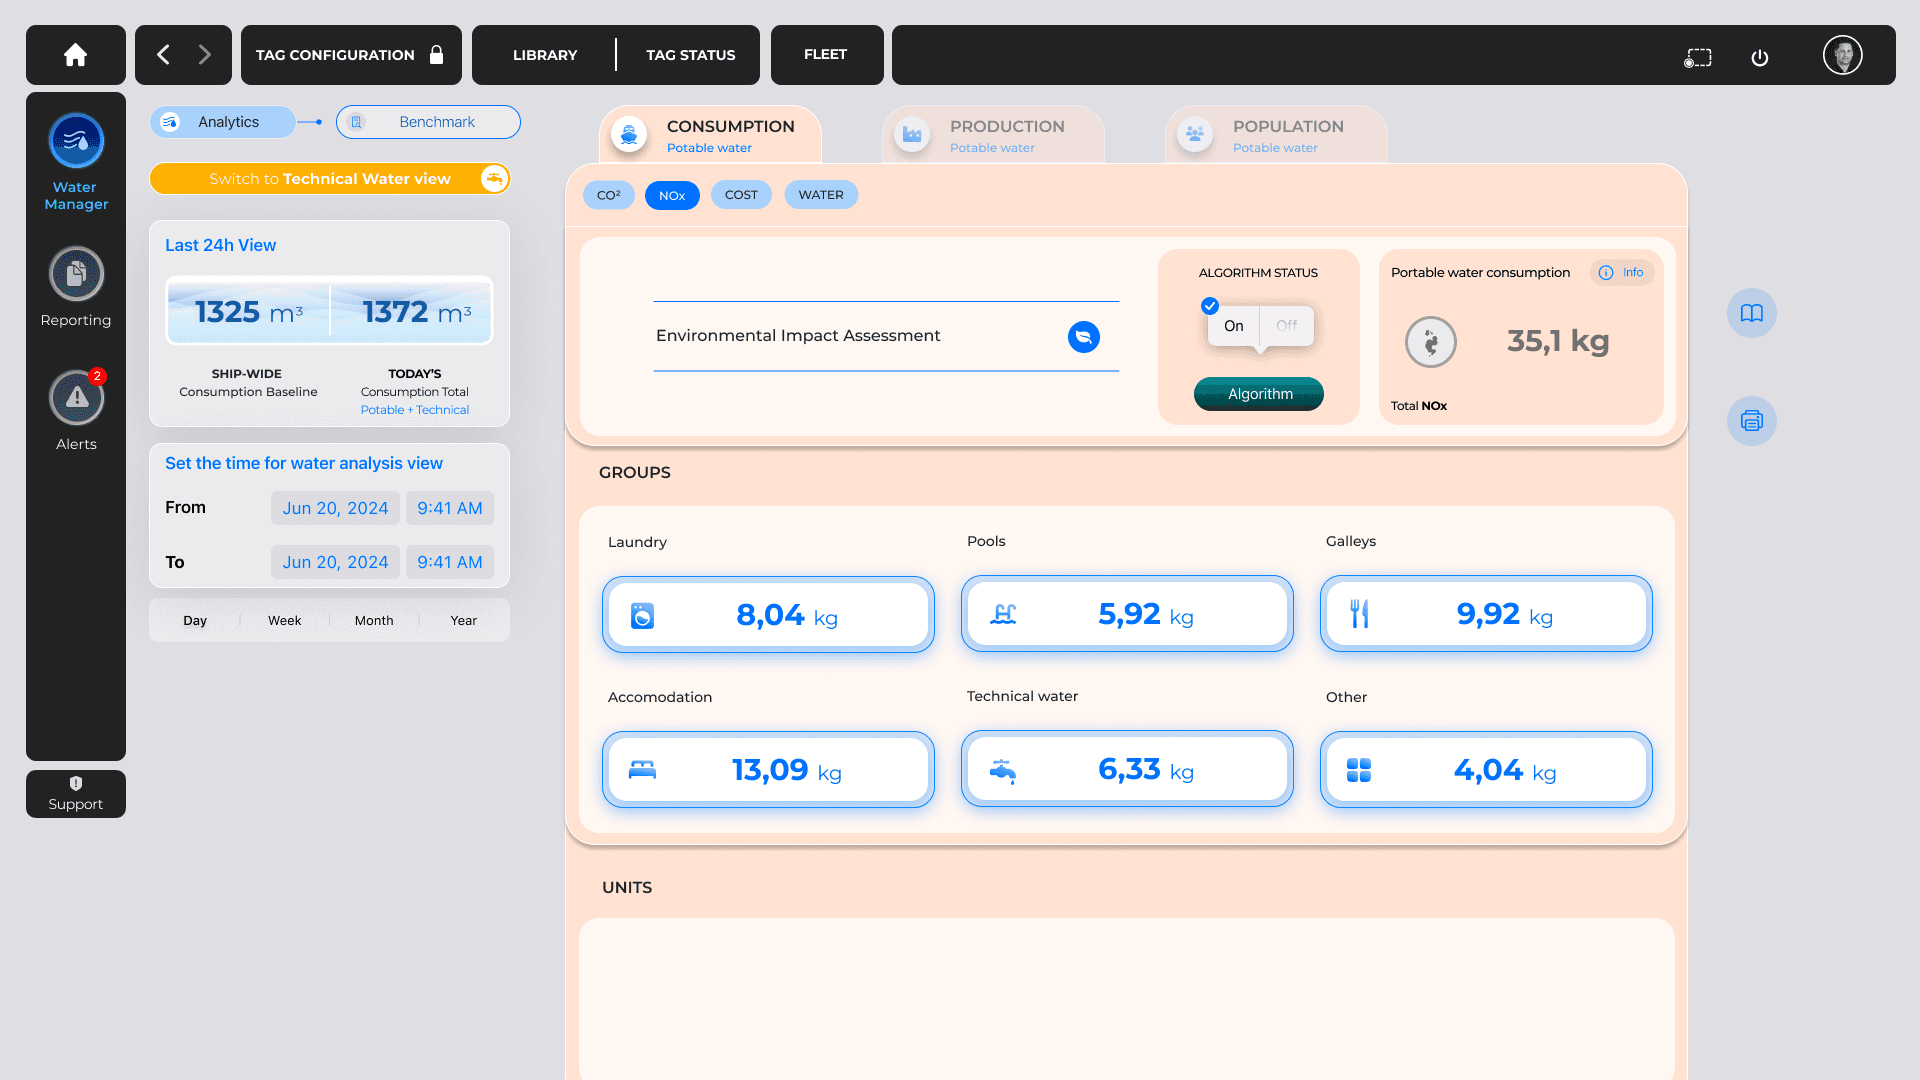
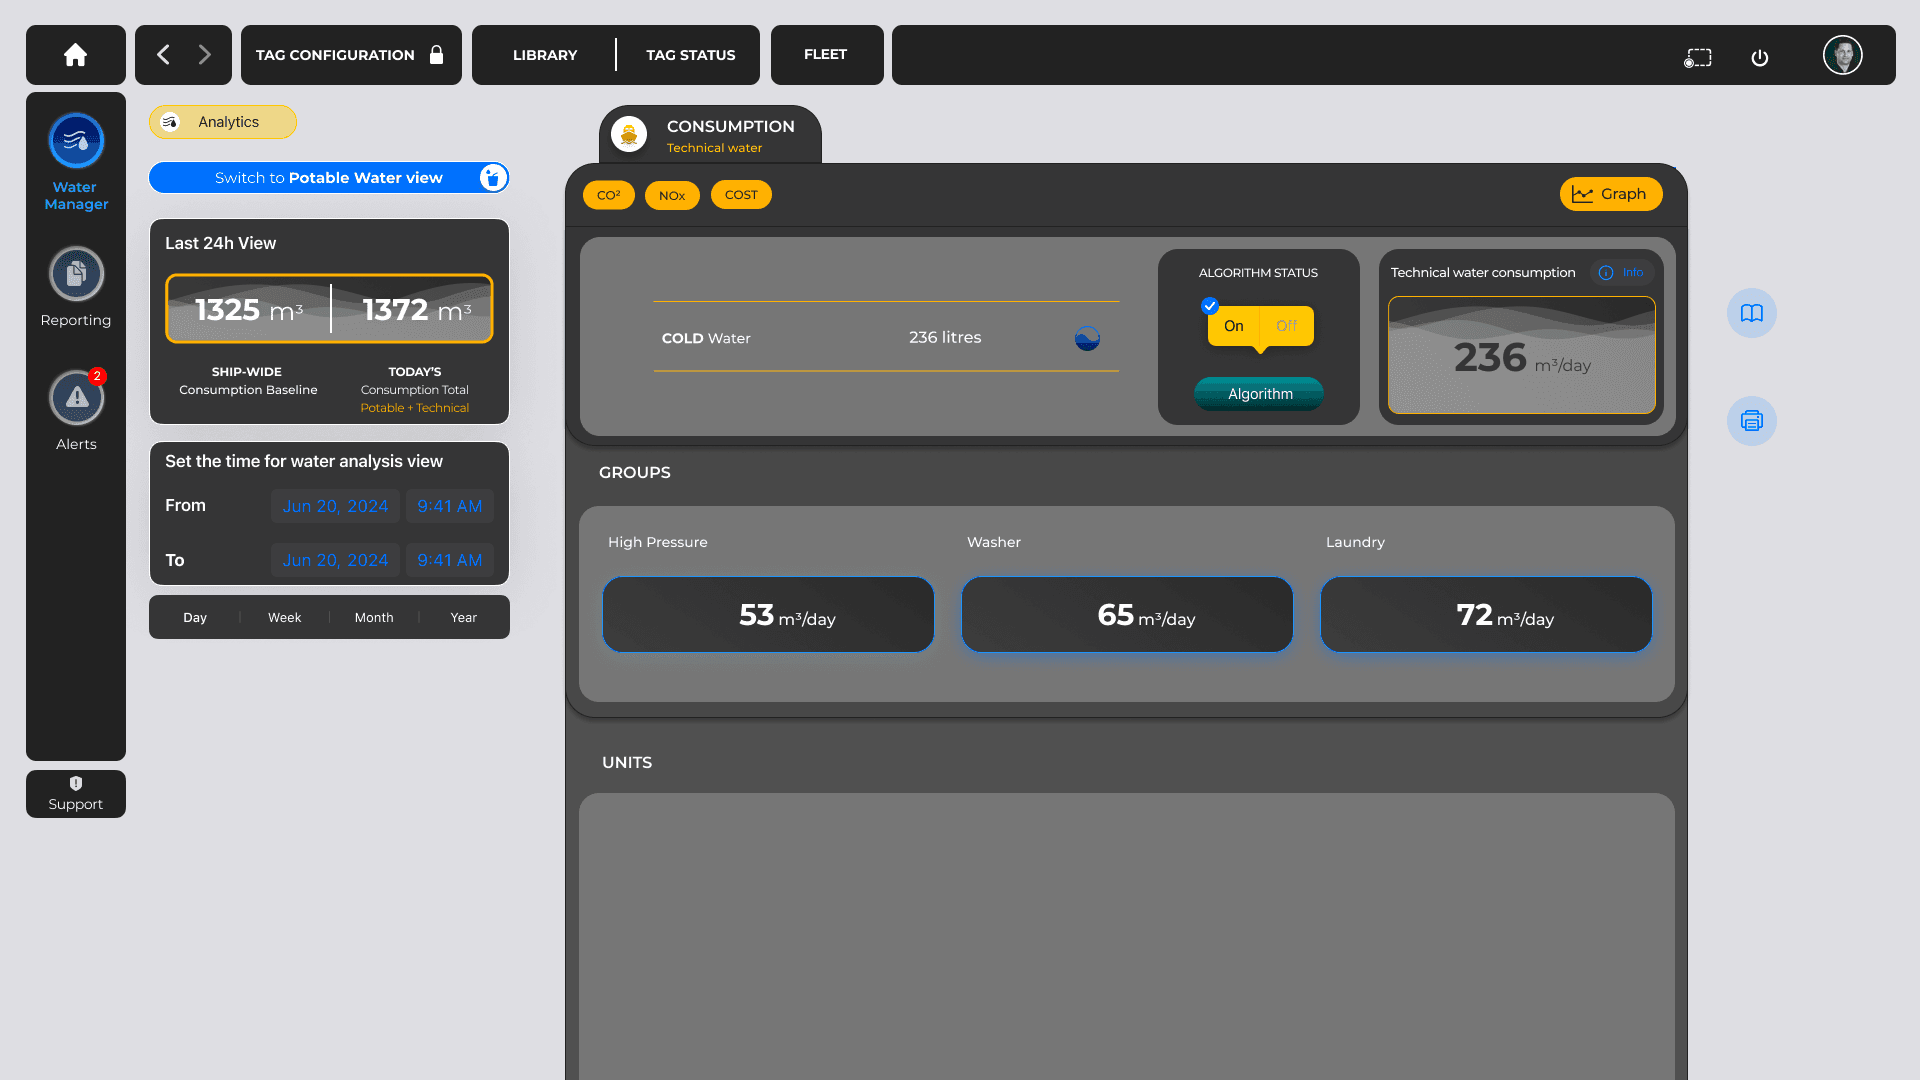
Dividing water consumption into categories for getting precise usage numbers. 


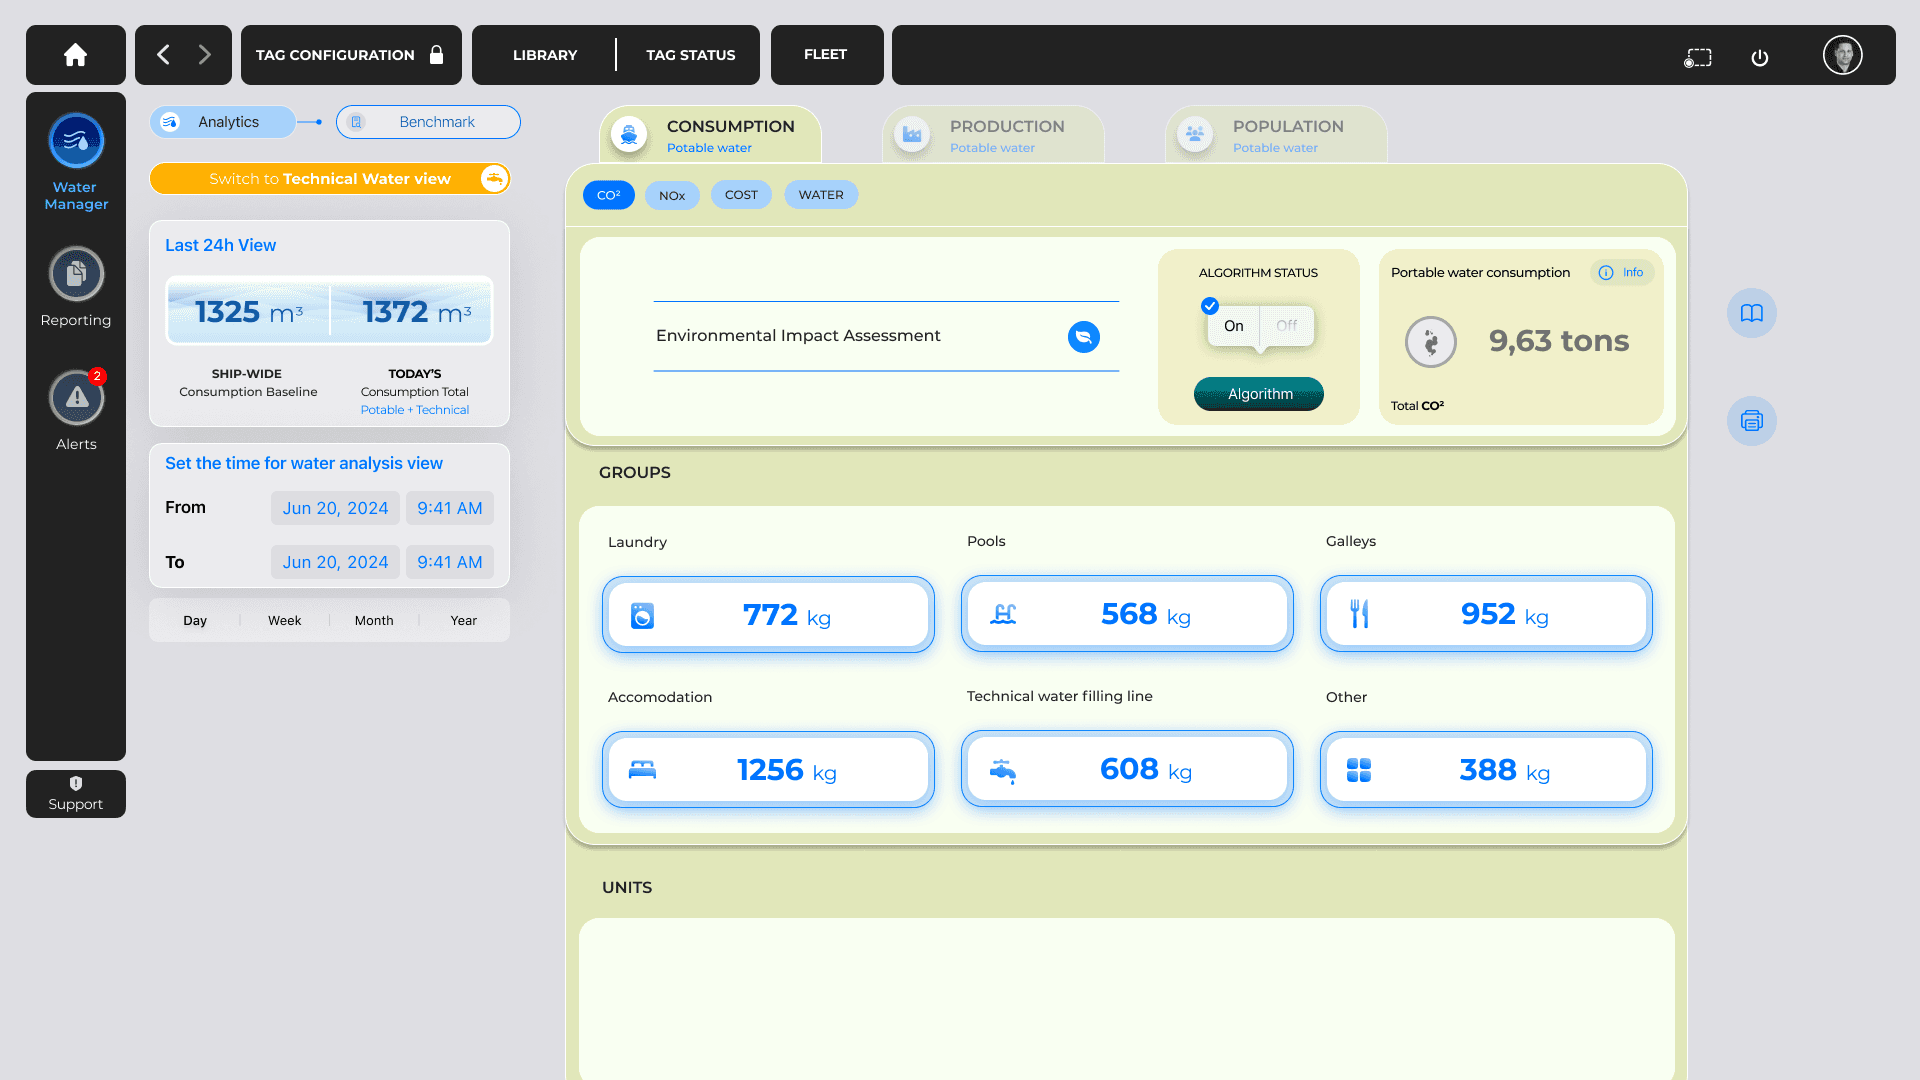
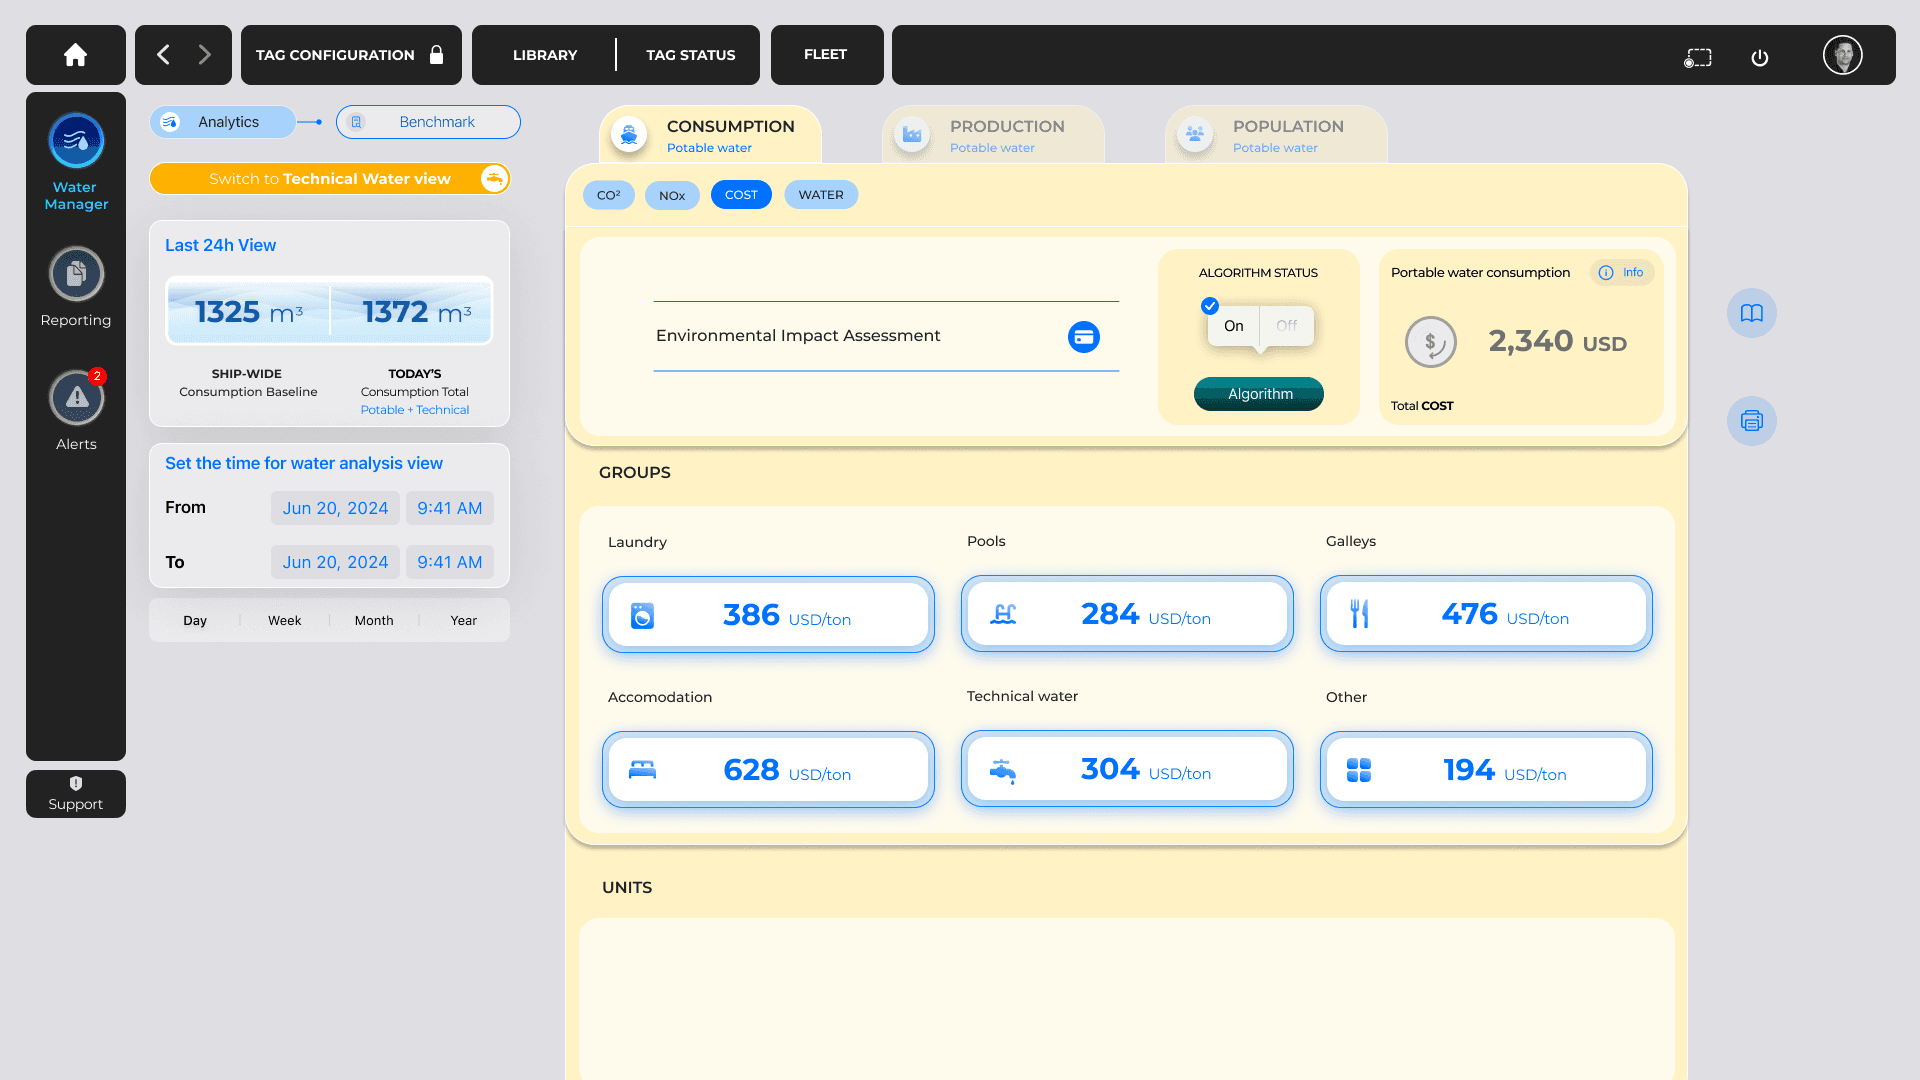
Converting water amounts into  Cost, CO2 and NOX data directly from Operating System.


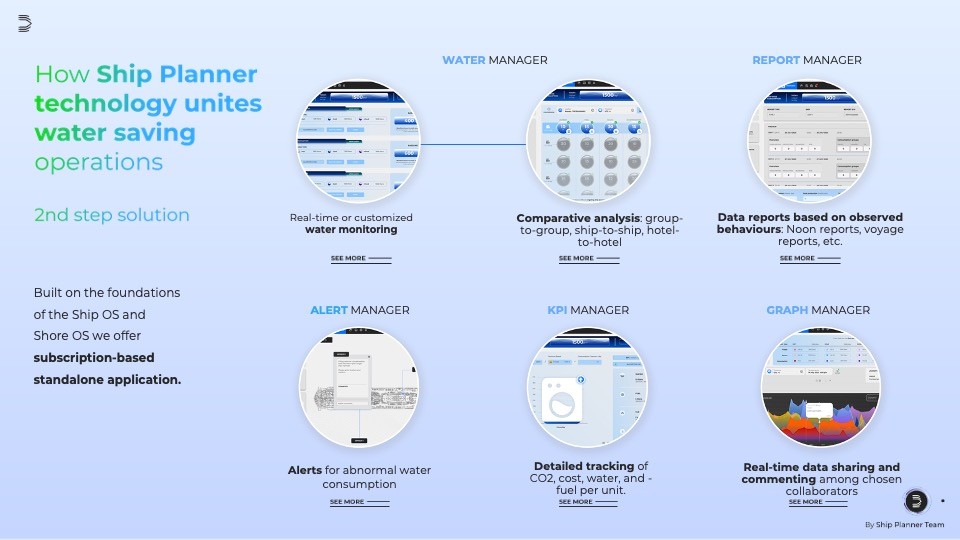
Introducing freestanding applications for tracking water data, detecting abnormal water behavior and benchmarking.

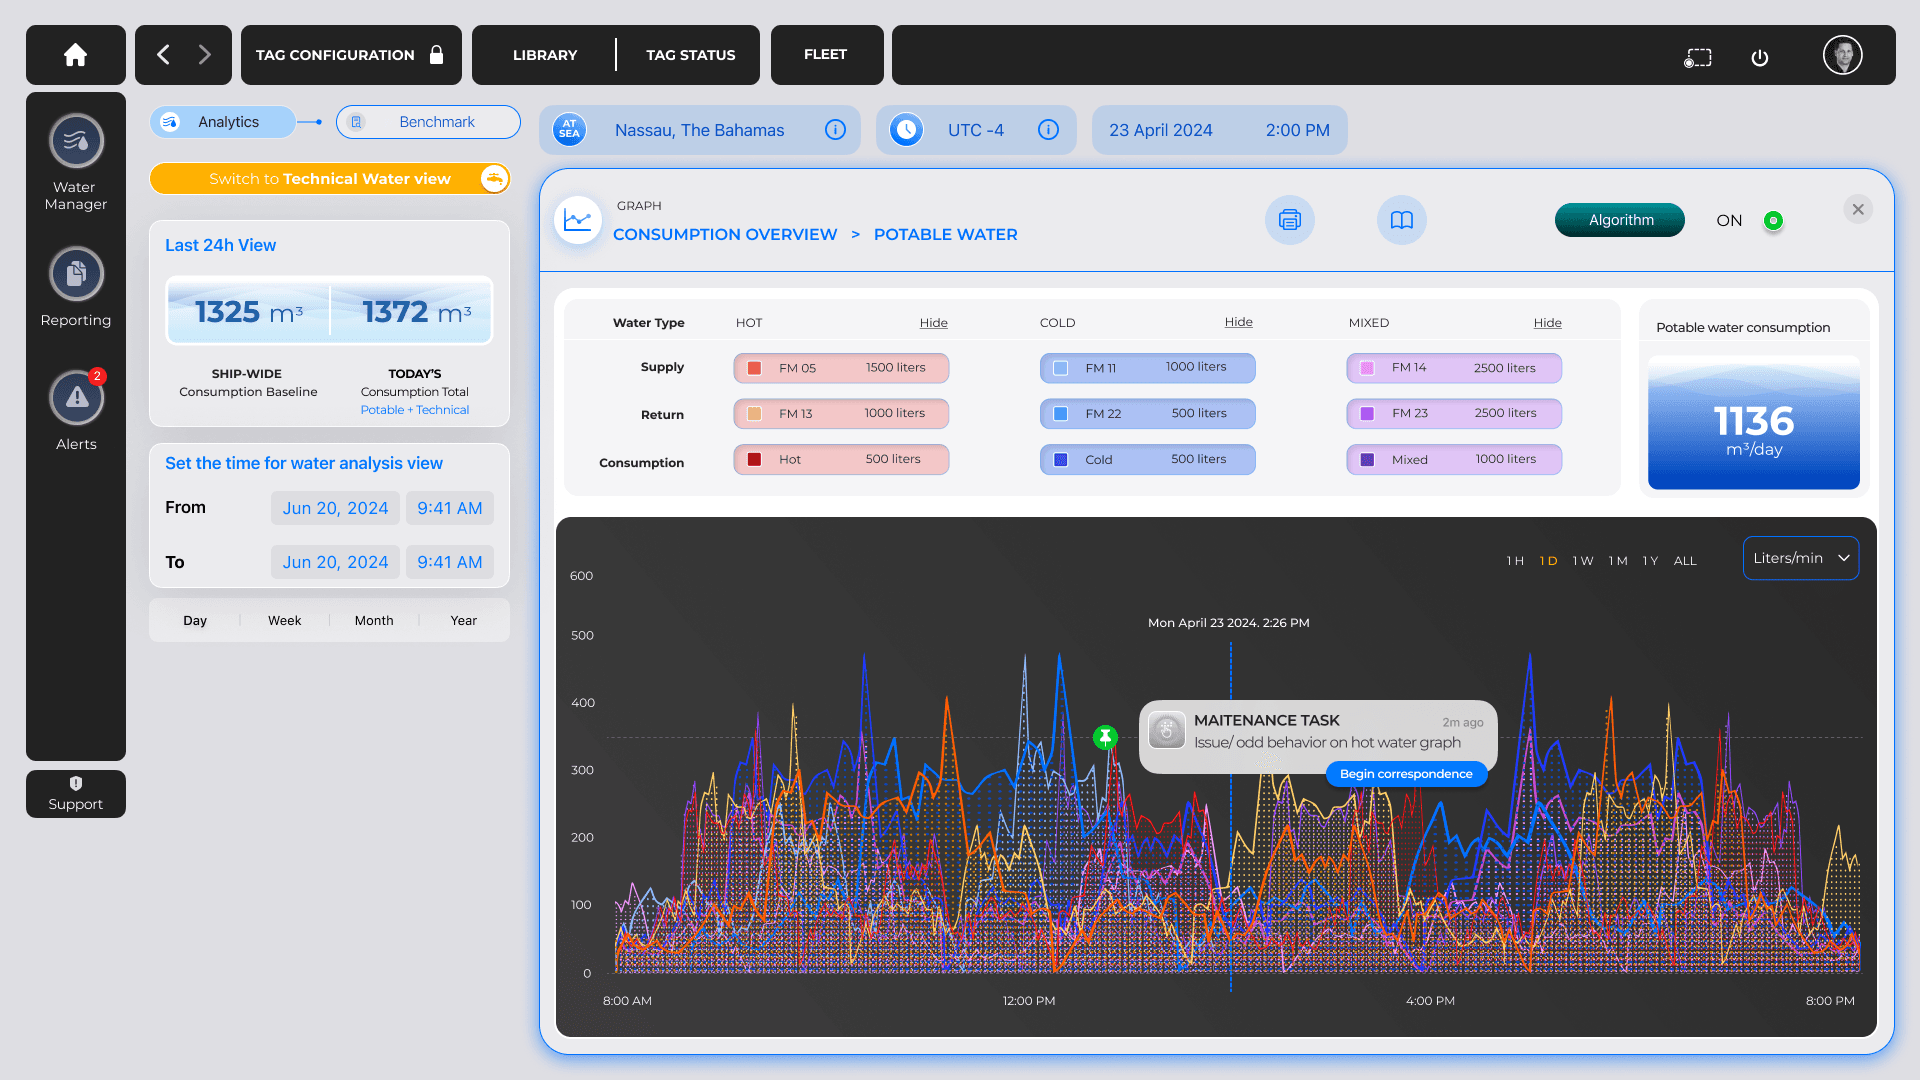
GRAPH MANAGER

GRAPH MANAGER

WATER GRAPH communicating tasks with real-time data

CO² VIEW

COST VIEW

NOX VIEW

WATER GRAPH communicating tasks with real-time data

WATER MANAGER

TECHNICAL WATER

WATER MANAGER

GRAPH MANAGER

WATER GRAPH communicating tasks with real-time data

CO² VIEW

COST VIEW

NOX VIEW

WATER GRAPH communicating tasks with real-time data

WATER MANAGER

TECHNICAL WATER

WATER MANAGER

05

MY ROLE

and

USER RESEARCH

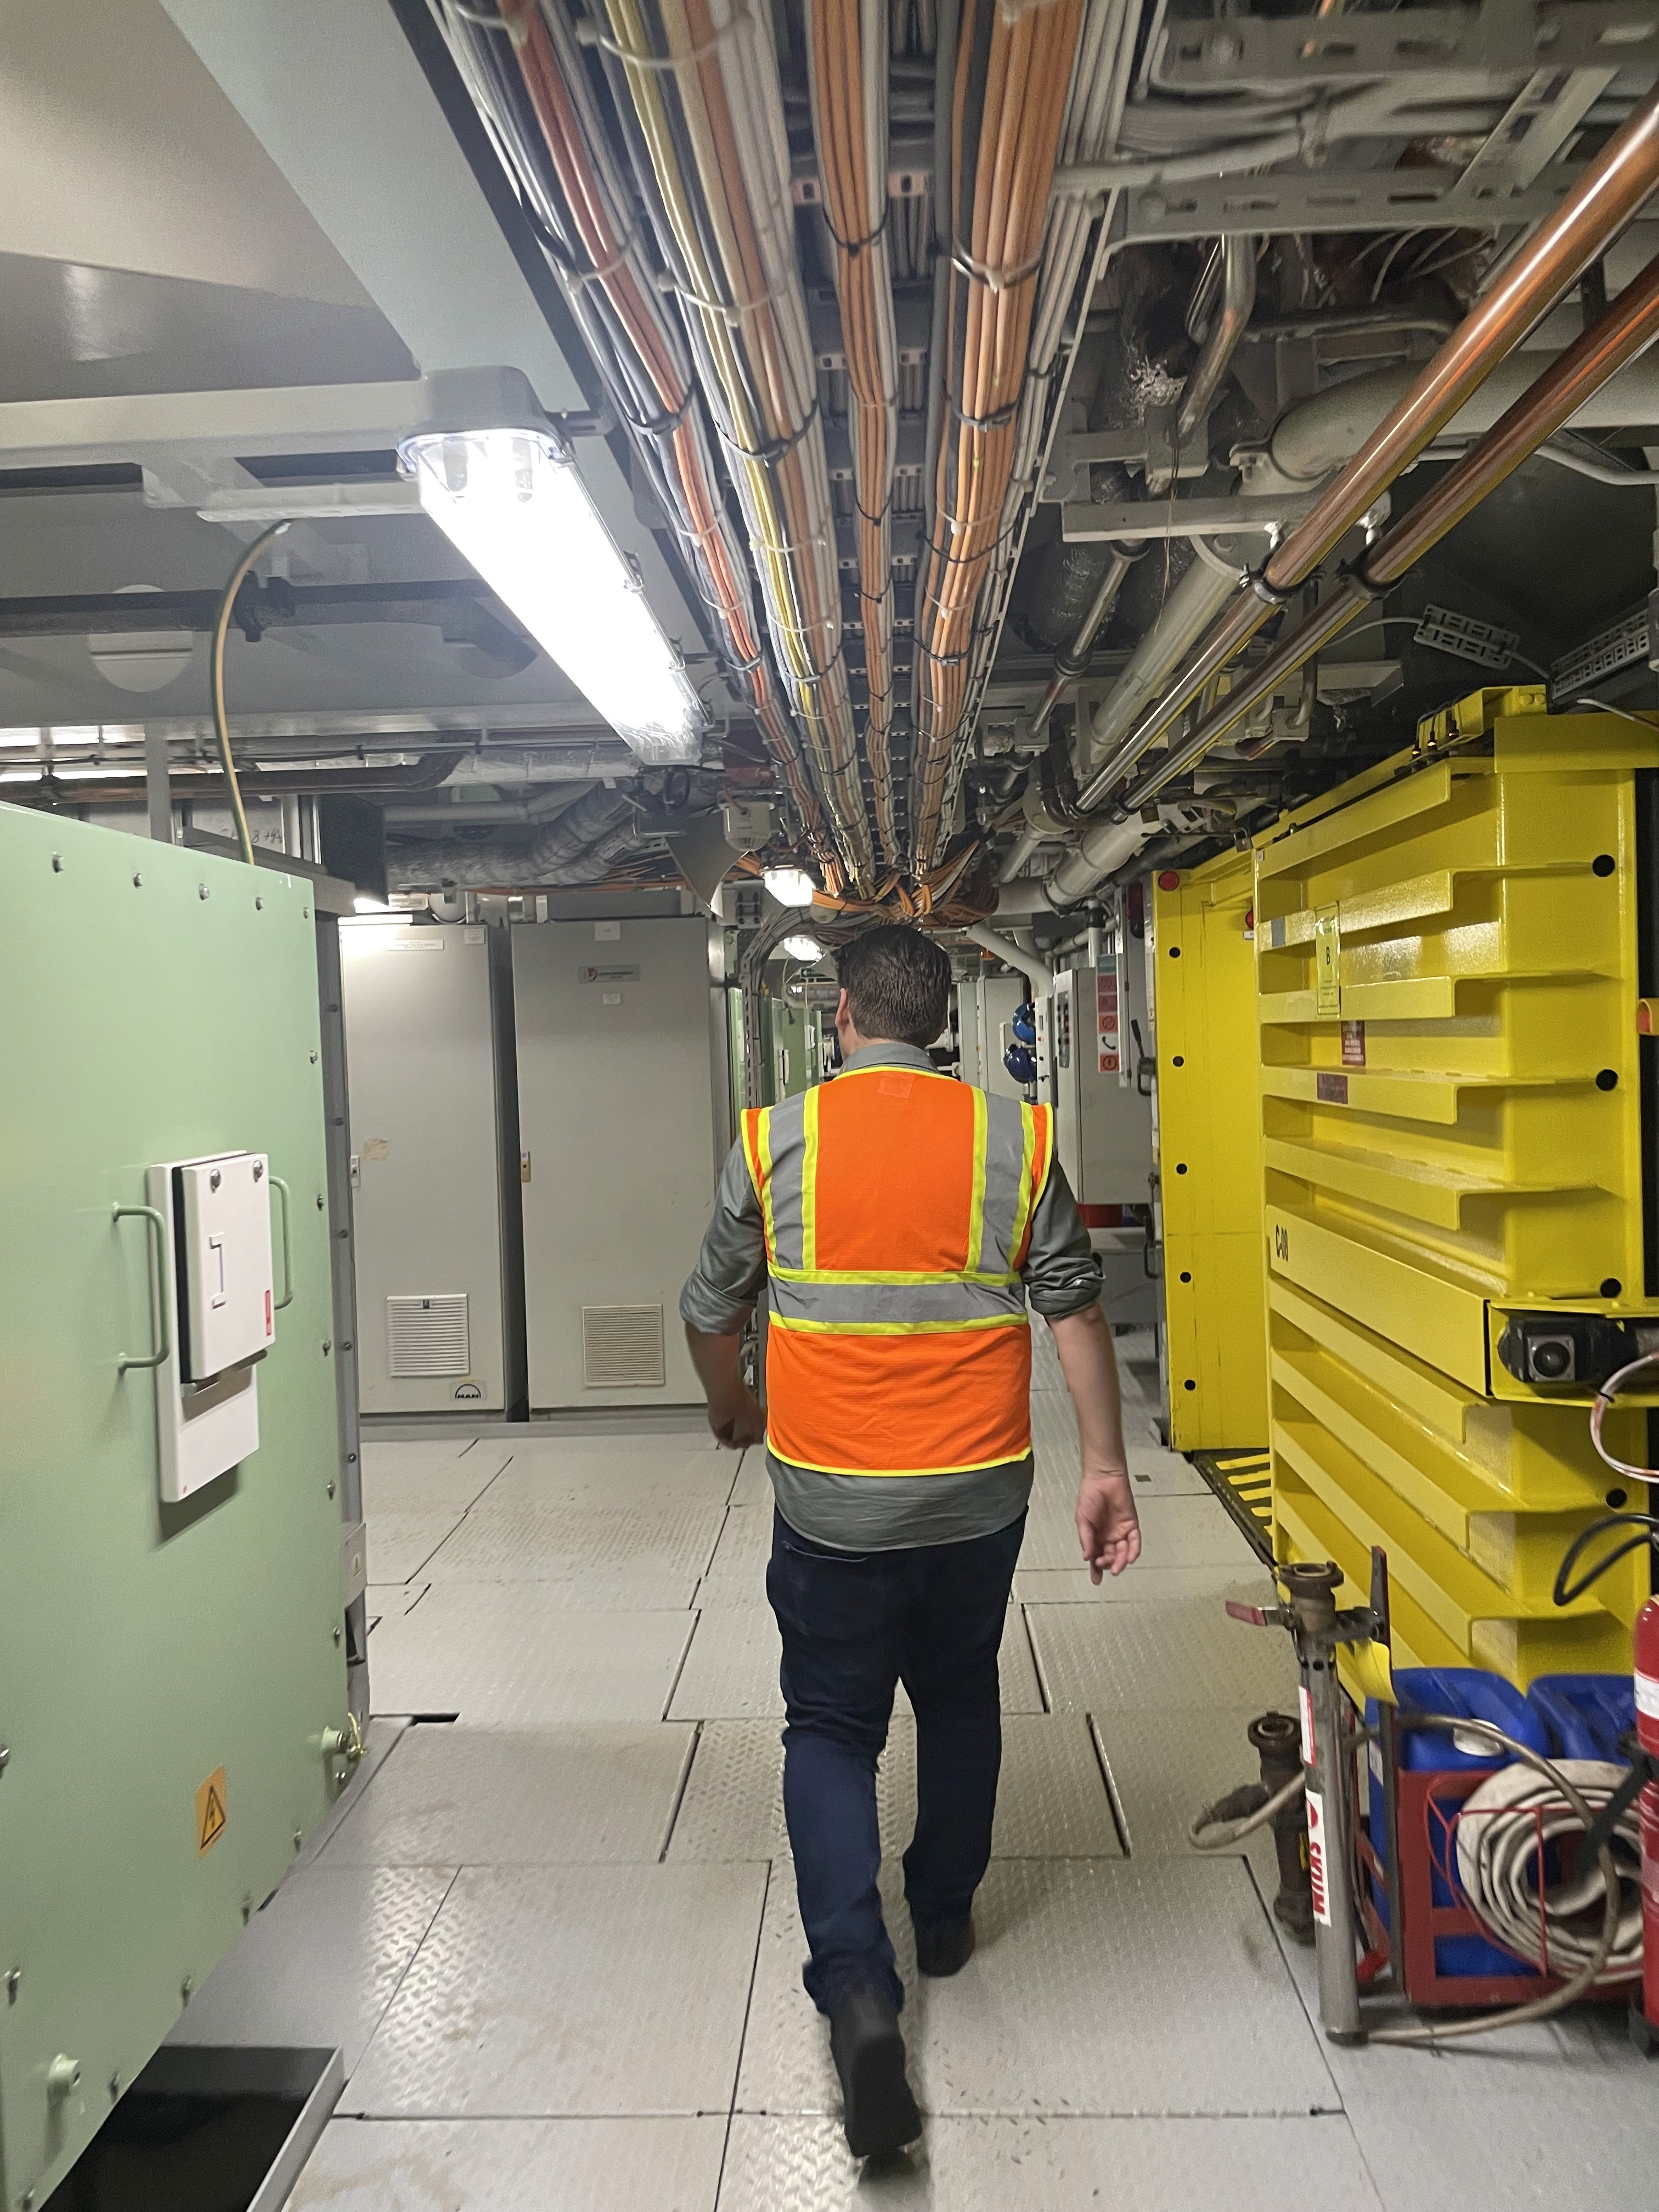
Participating technology testing with comprehensive customer analysis  to understand needs, behaviors and pain points of potential users.


Documenting and presenting POC to Innovation Norway.


Defining the content, functionality and design.


Working with UI designers to ensure the user interface is aligned with the user experience.


Communicating design specifications and user flows to developers.

06

USE CASE

Each OS tool and freestanding applications had Use Case designed for continuous product discovery. 

It helped  to avoid costly design errors and better understand the product in total.

BENCHMARKING

BENCHMARKING

ALERT MANAGER

ALERT MANAGER

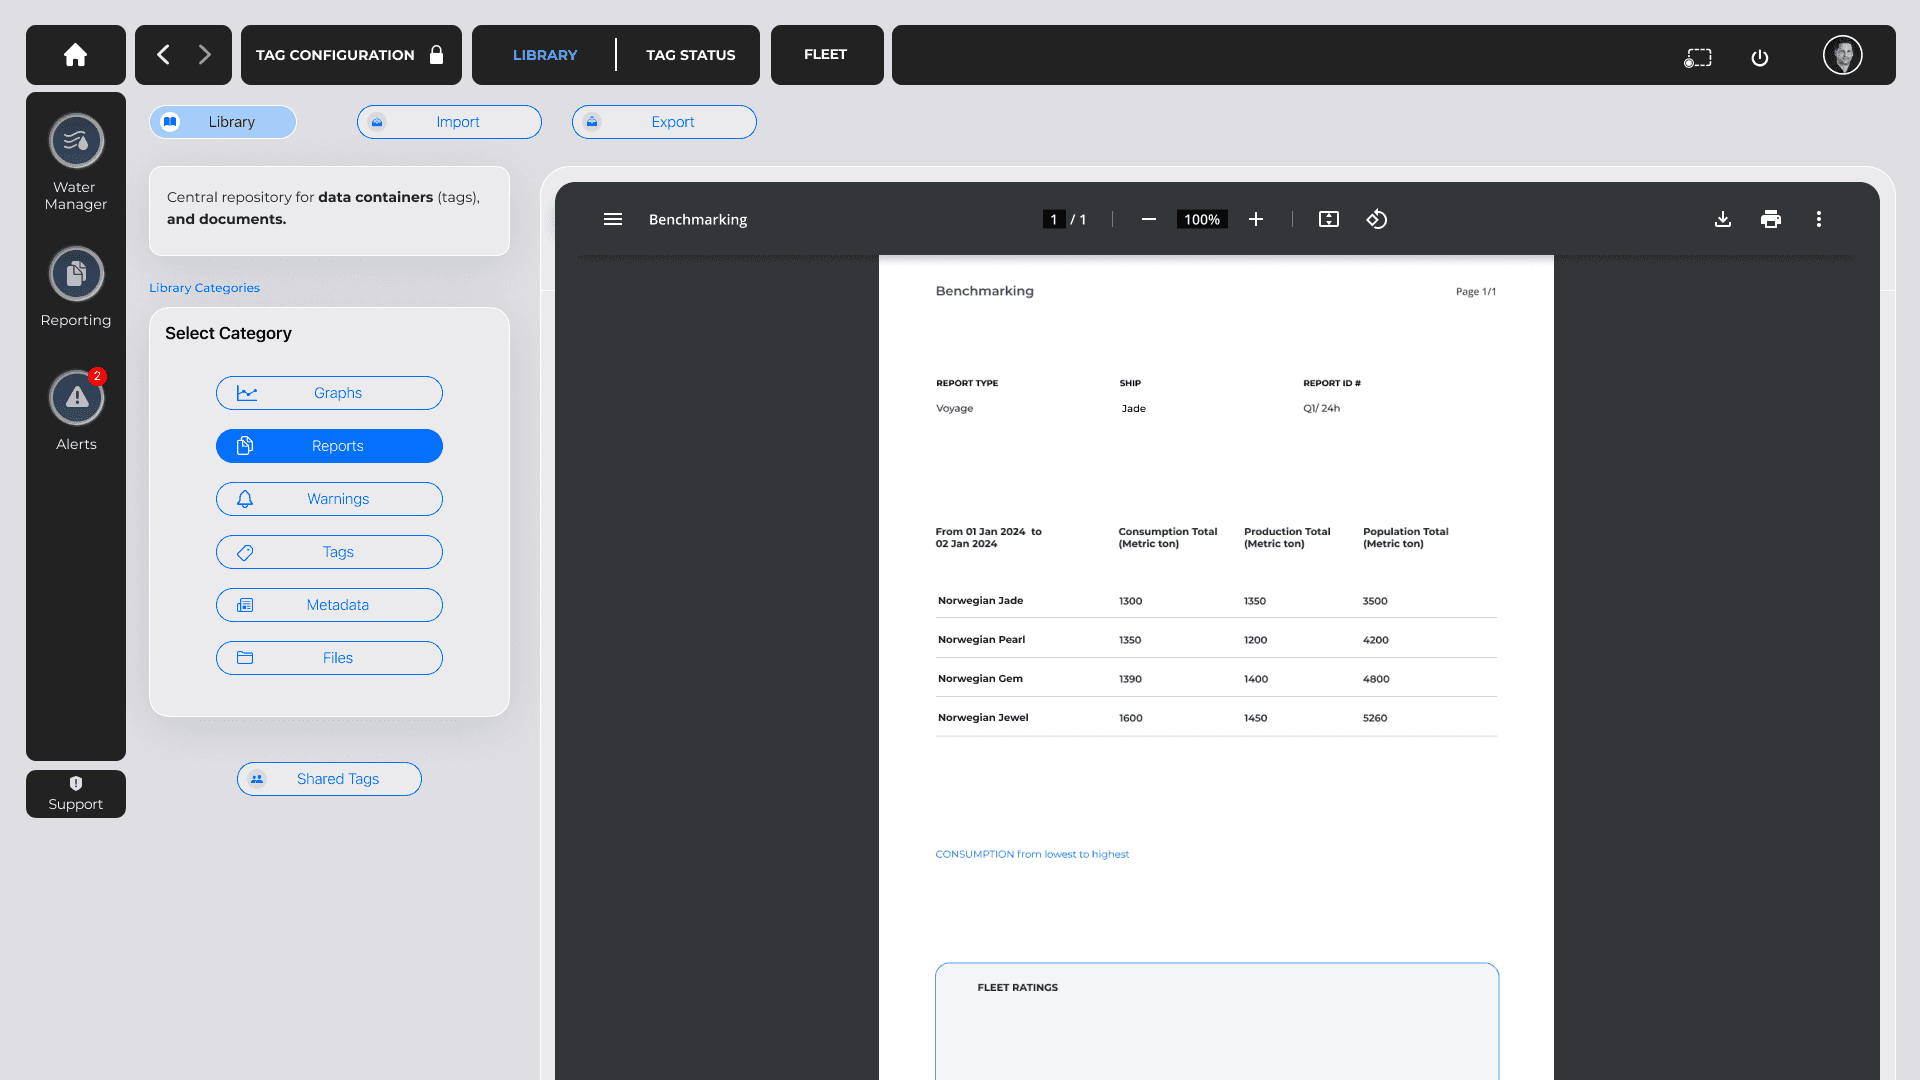
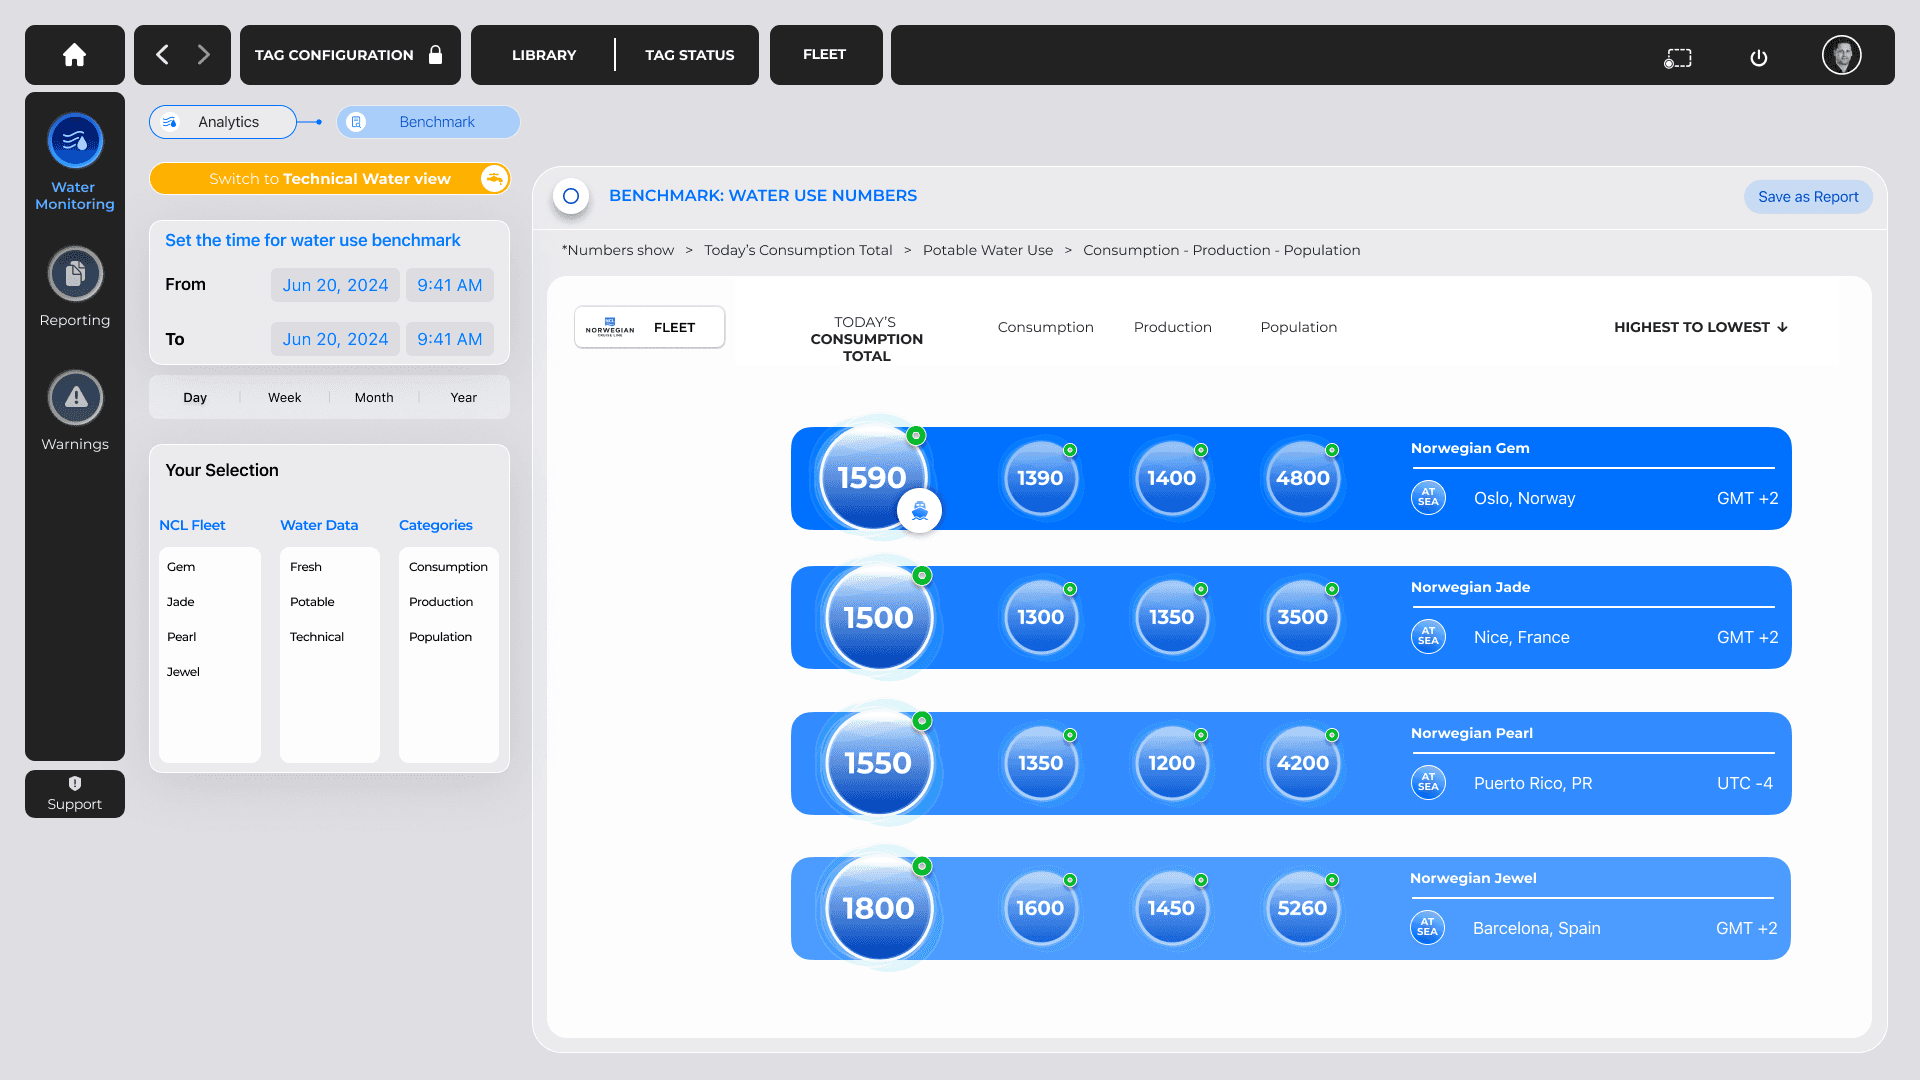
The CFO calls the Executive Fleet manager to ask which ship has the lowest water consumption numbers for Q1 / 24. 

01

The Executive Fleet manager goes into the report Manager, picks the time-frame Jan 01 to March 31 (quick access button Q1), and selects the following settings: All ships - Ship wide consumption - Lowest to highest   

02

Ship 3 reports the lowest total consumption figures, and the executive fleet manager e-mails the CFO a screenshot PDF export with consumption numbers and fleet ratings.

03

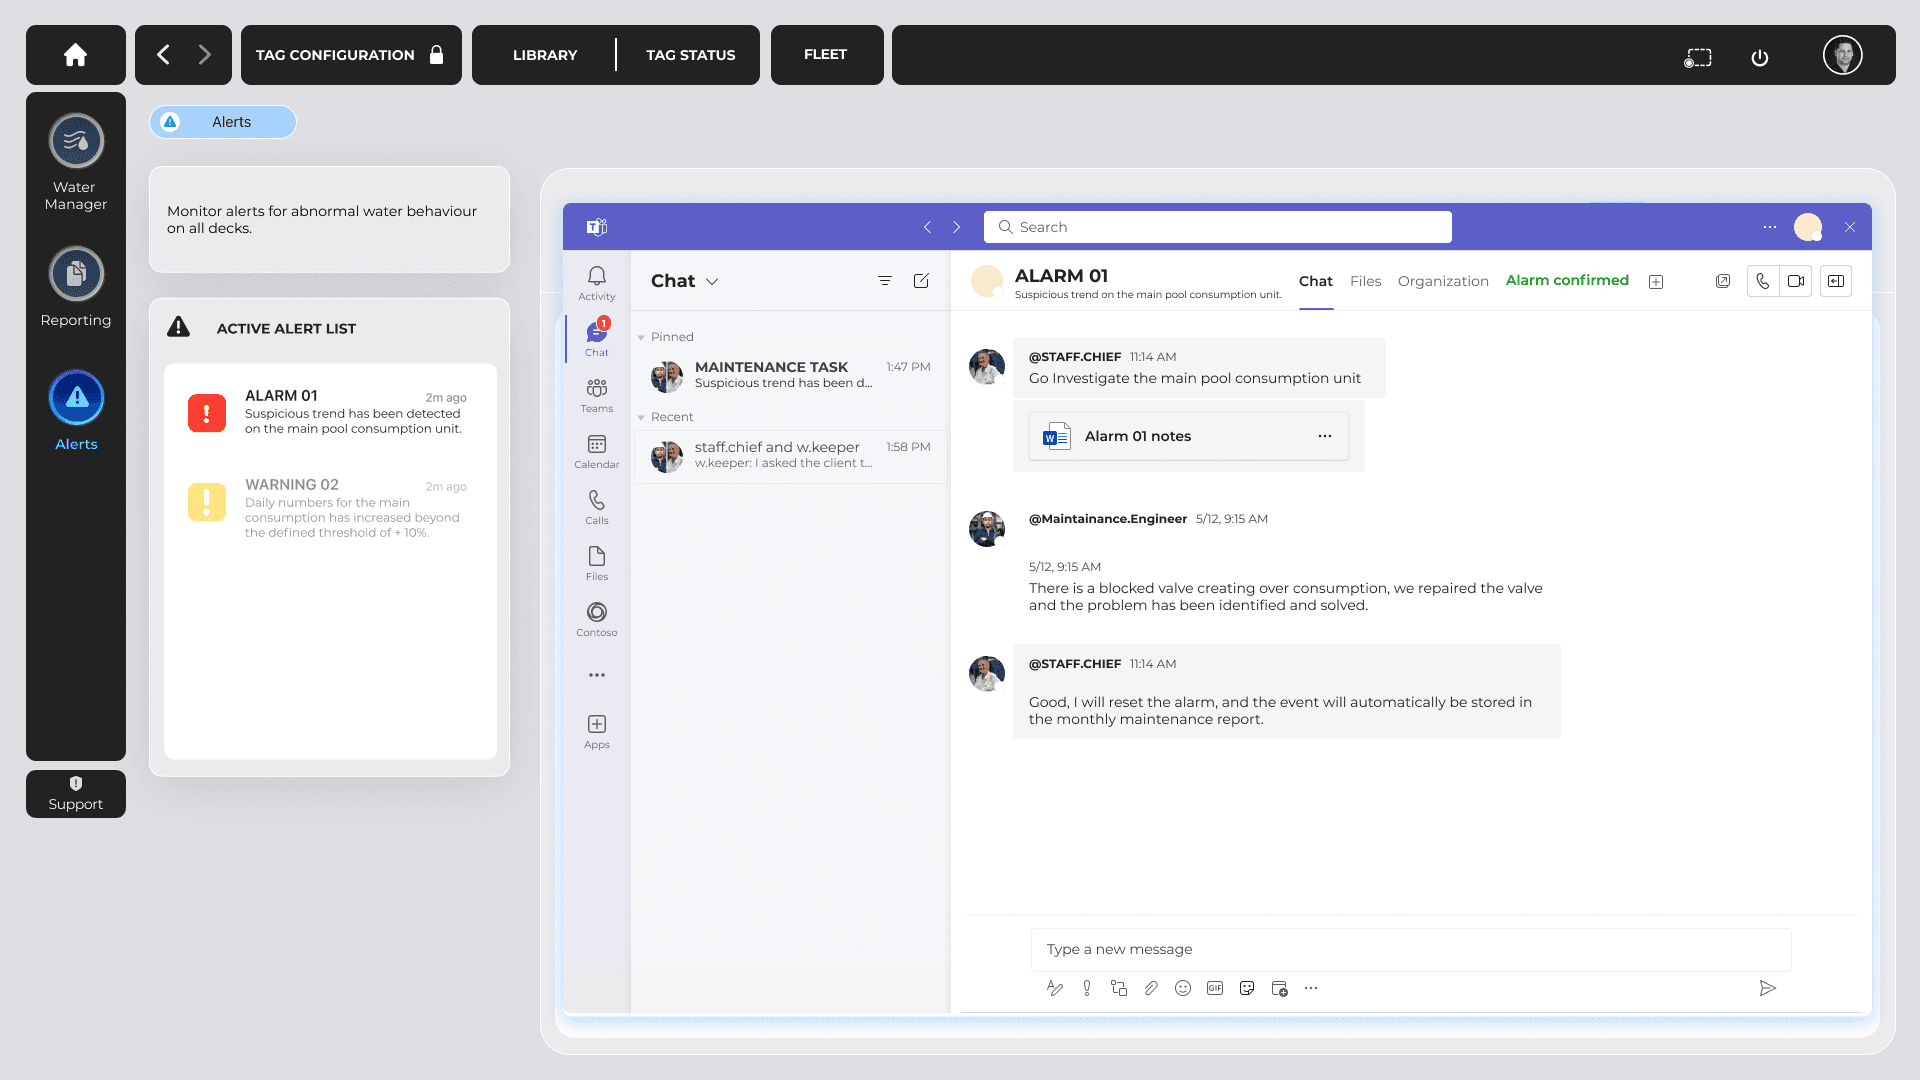
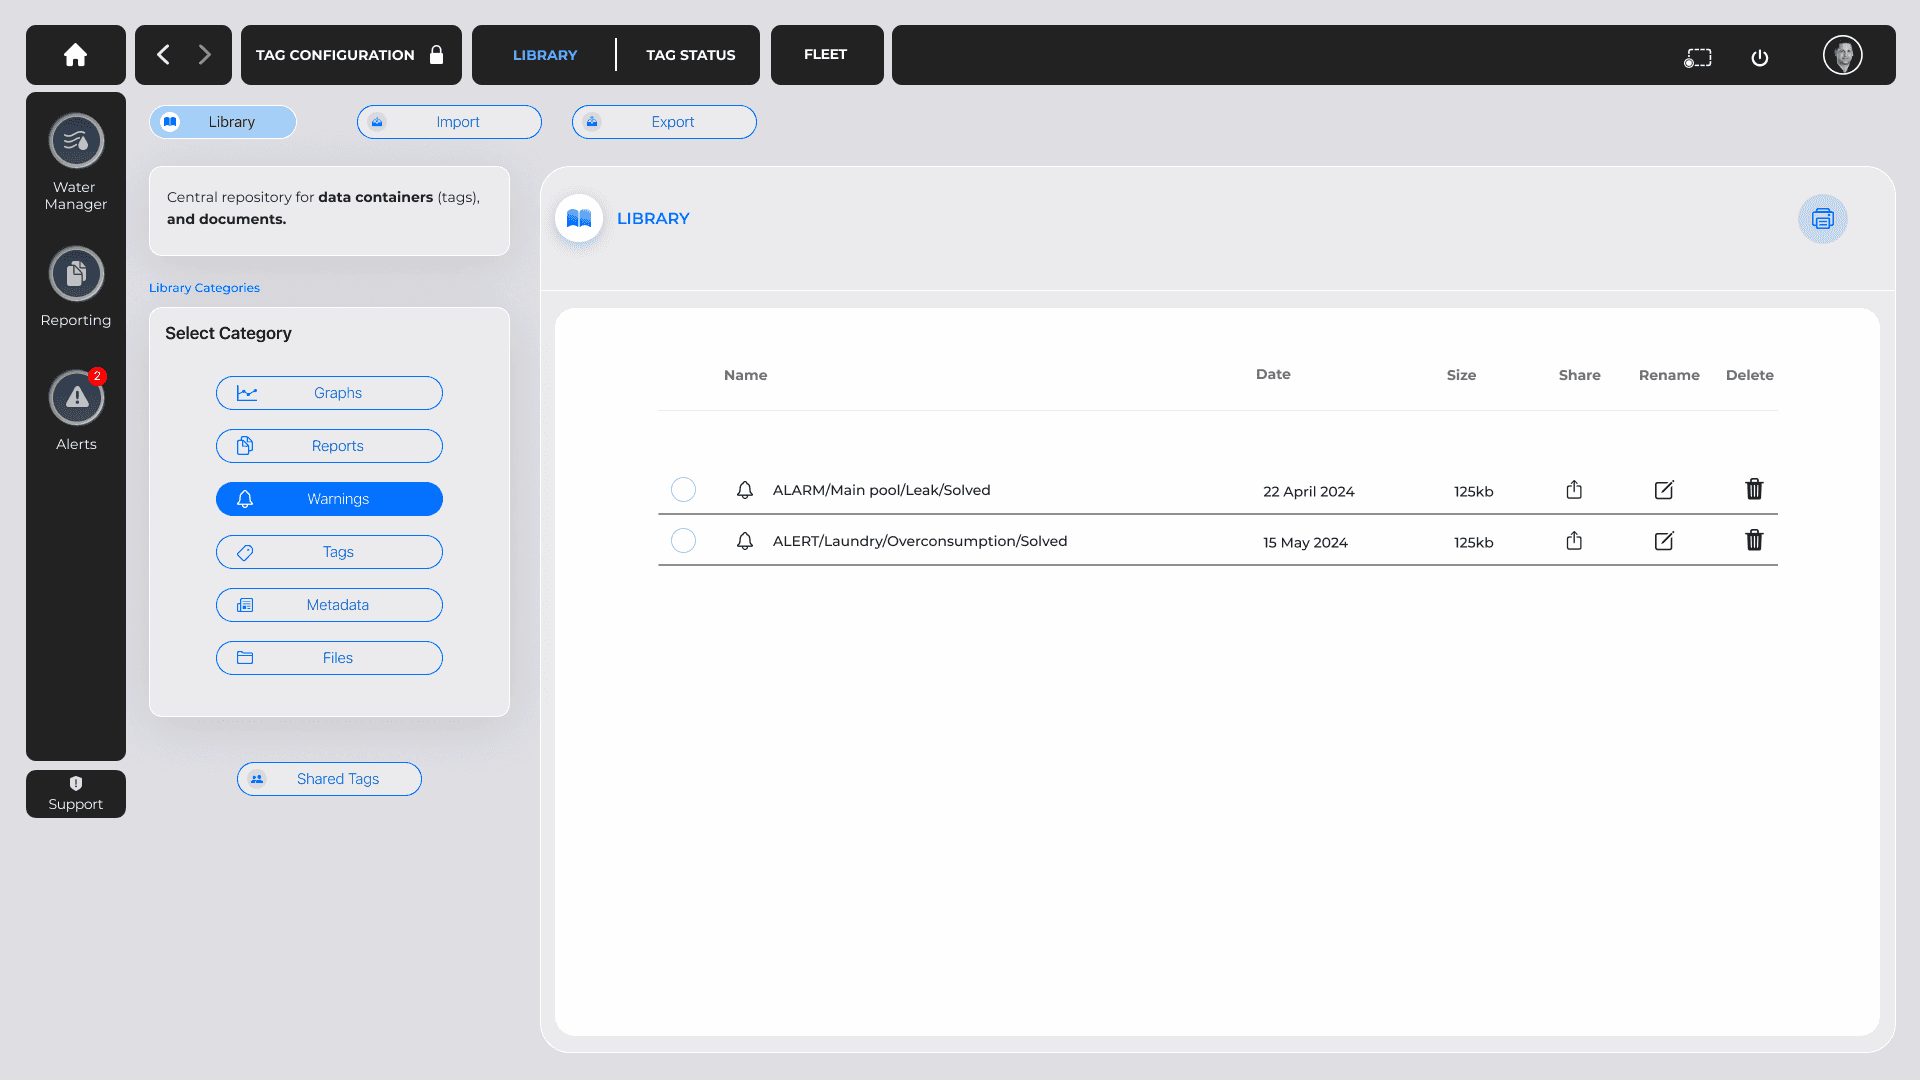
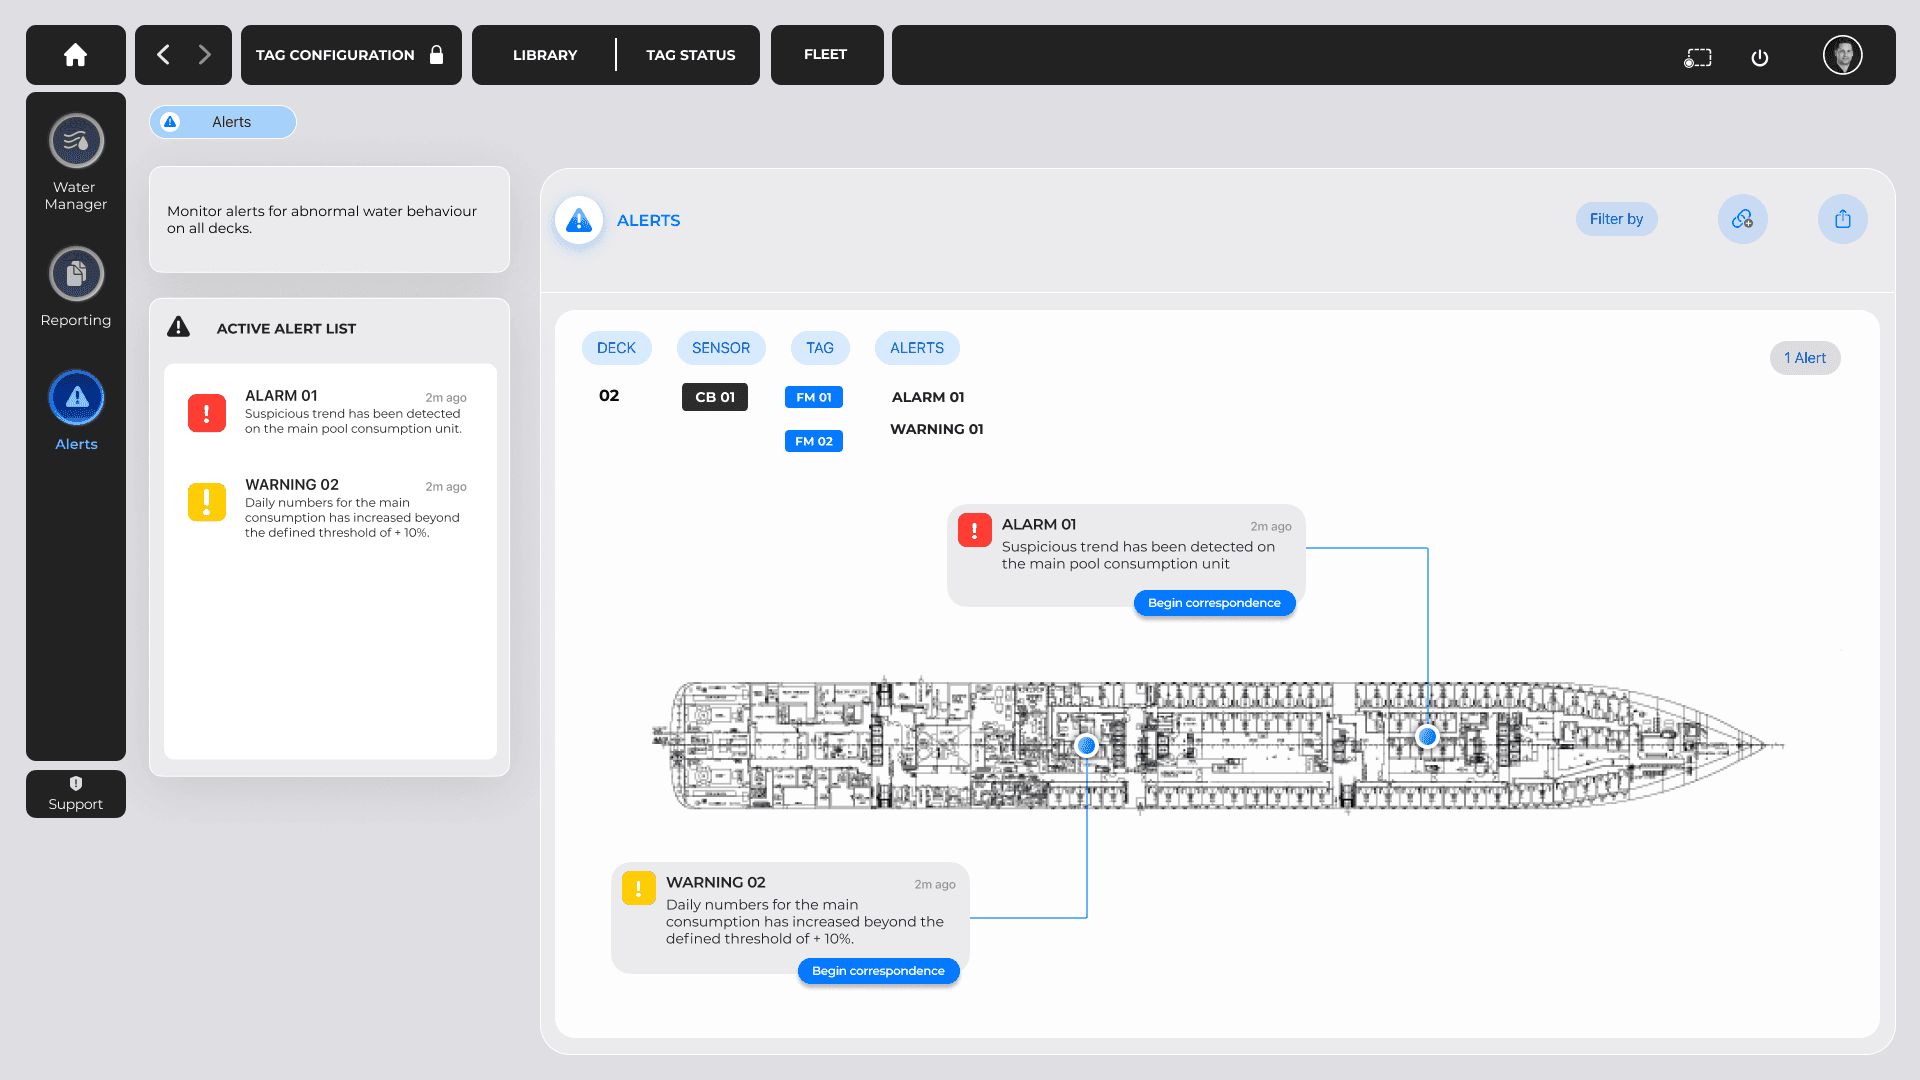
While the Chief Engineer is having lunch in the mess room, he receives a general alert on his phone from the company e-mail. This warning informs that daily numbers of the main consumption has increased beyond the defined threshold of +10%. The Chief confirms the alert and adds it to his user task list for later investigation.

01

Later in the day the chief opens the water manager and understand quickly that most of the added consumption is coming from the Laundry. The chief then creates a task for the watch keeper to go to the laundry, investigate and submit a report with probable causes.  

02

Based on this report the chief understands that the additional consumption is caused by the laundry crew, having forgotten to turn off the filter cleaning system for one of the washing machines after night shift, and creates a laminated note for all laundry workers to remember this as part of their shift routine.  

03

BENCHMARKING

ALERT MANAGER

The CFO calls the Executive Fleet manager to ask which ship has the lowest water consumption numbers for Q1 / 24. 

01

The Executive Fleet manager goes into the report Manager, picks the time-frame Jan 01 to March 31 (quick access button Q1), and selects the following settings: All ships - Ship wide consumption - Lowest to highest   

02

Ship 3 reports the lowest total consumption figures, and the executive fleet manager e-mails the CFO a screenshot PDF export with consumption numbers and fleet ratings.

03

While the Chief Engineer is having lunch in the mess room, he receives a general alert on his phone from the company e-mail. This warning informs that daily numbers of the main consumption has increased beyond the defined threshold of +10%. The Chief confirms the alert and adds it to his user task list for later investigation.

01

Later in the day the chief opens the water manager and understand quickly that most of the added consumption is coming from the Laundry. The chief then creates a task for the watch keeper to go to the laundry, investigate and submit a report with probable causes.  

02

Based on this report the chief understands that the additional consumption is caused by the laundry crew, having forgotten to turn off the filter cleaning system for one of the washing machines after night shift, and creates a laminated note for all laundry workers to remember this as part of their shift routine.  

03

07

WIREFRAME

Fulfilling Requirement Gathering.


Creating multiple proposals.


Initial Sketches.

08

PROTOTYPING

PROTOTYPING

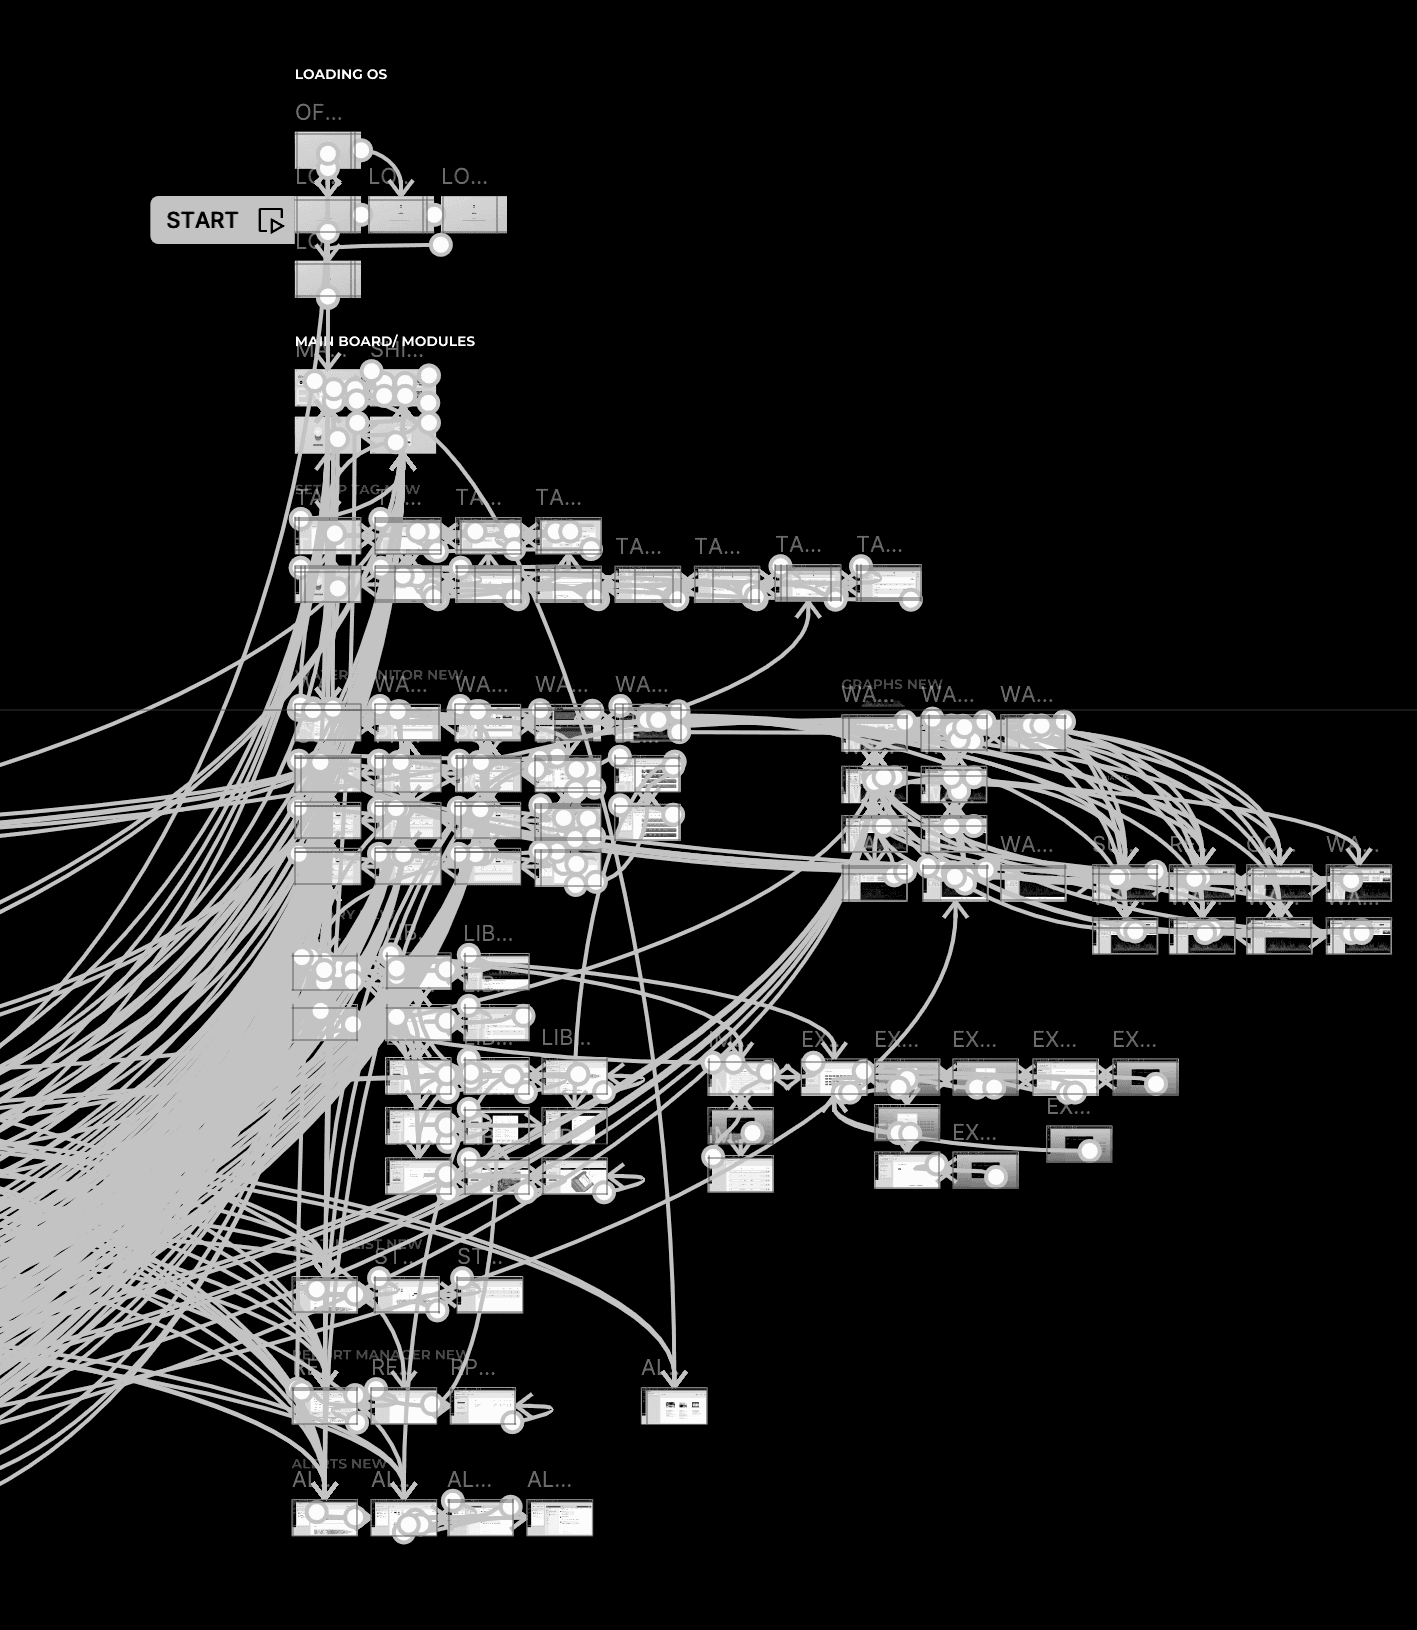
Using Figma's interface, the wireframes were transformed into interactive prototypes by adding clickable hotspots.

Using Figma's interface, the wireframes were transformed into interactive prototypes by adding clickable hotspots.

09

DEVELOPMENT AND HADOFF

DEVELOPMENT AND HADOFF

Collaboration with Developers:

Closely collaborated with the several development teams to ensure the design is implemented accurately.


This involves:

Providing detailed design specifications and assets.

Participating in regular check-ins to address any questions or issues.

Ensuring the Ship OS is responsive and works well on various devices.

PARTNERS

PARTNERS

10

SHIP OS

TESTING

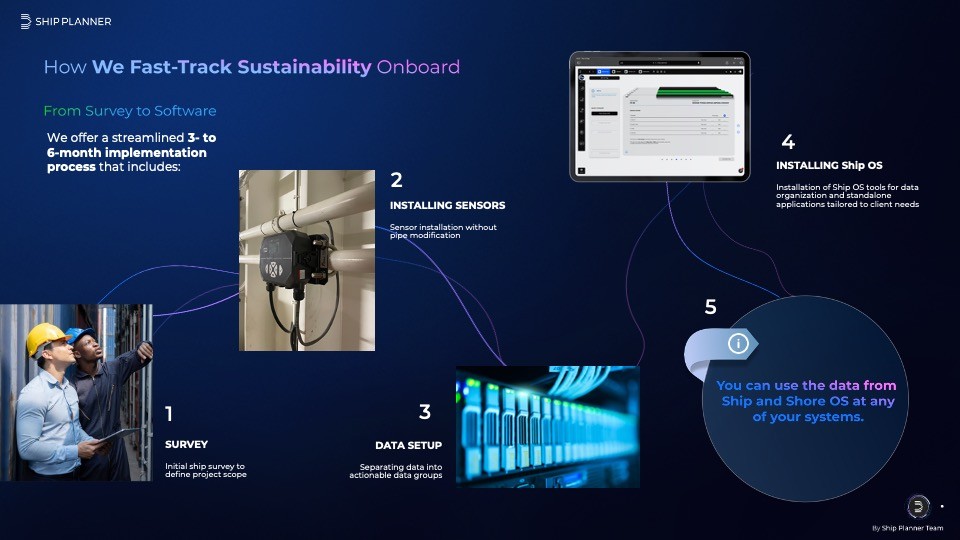
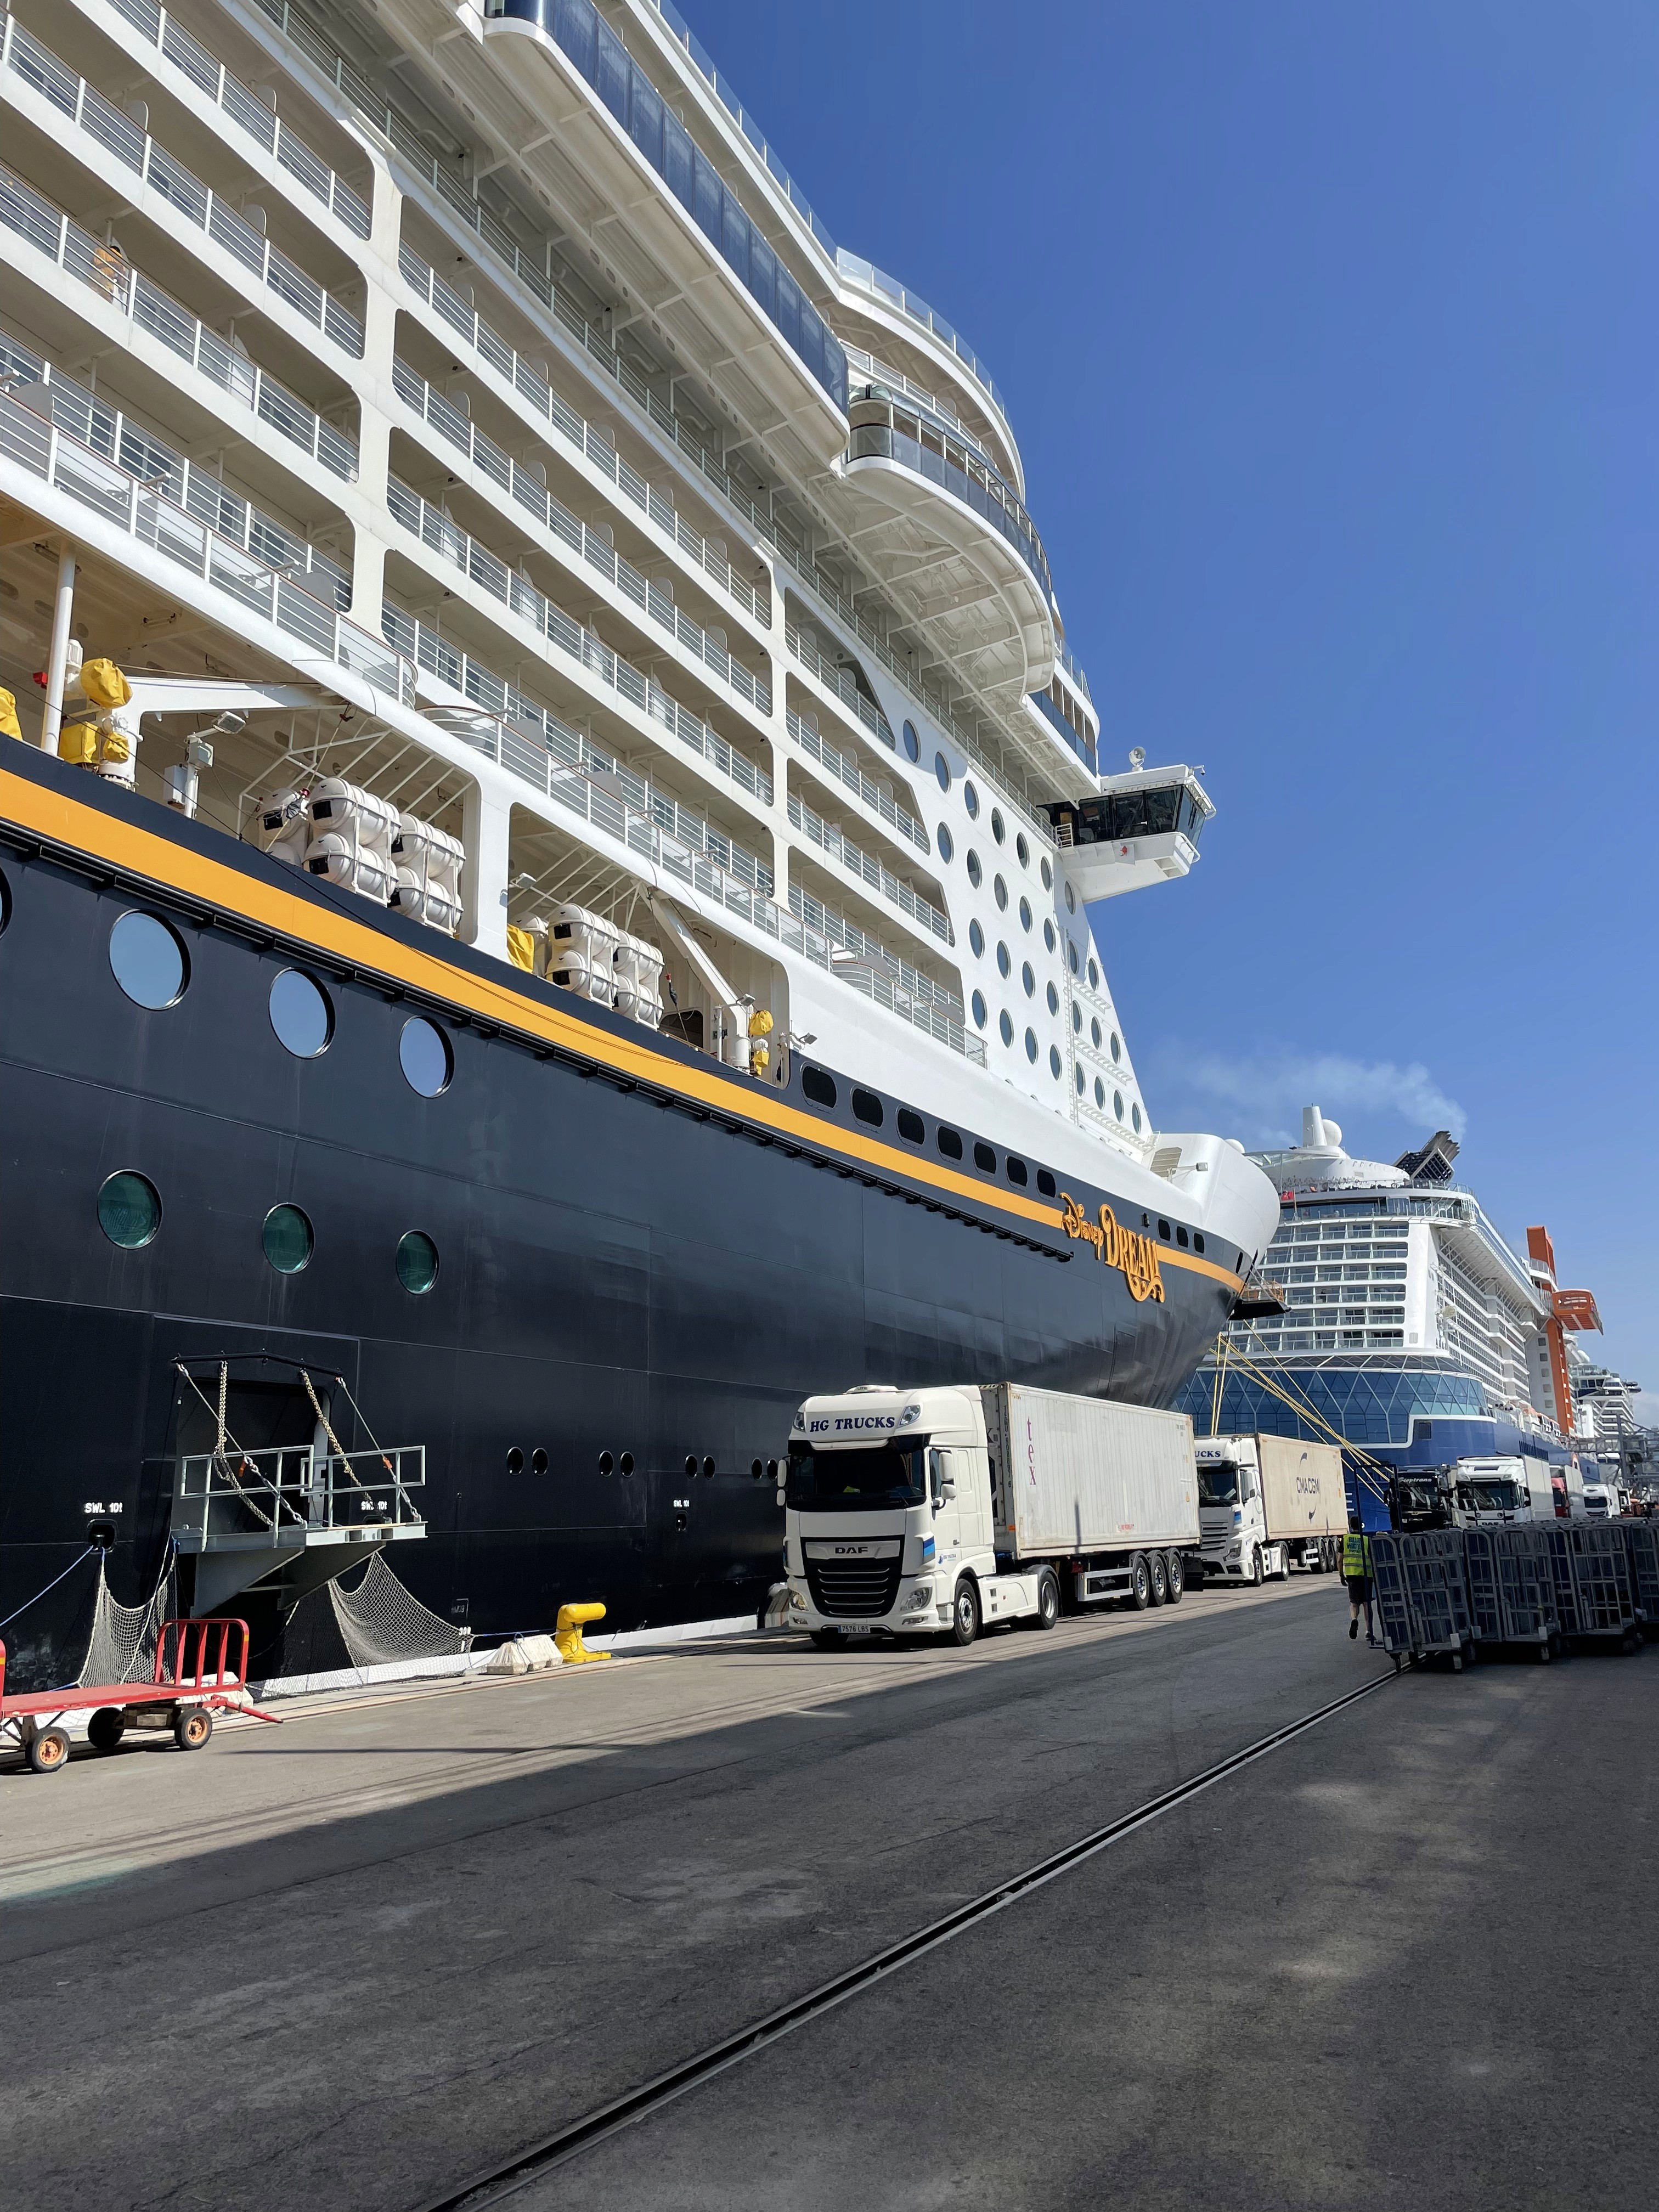
Ship OS 2.0 version was successfully installed on ships at 2 major cruise liners. 

Data was transferred via fire-walls from ship to shore and investigated by 3rd party IT team. 

Accuracy of the data is approved as perfect water data.